
Dairy farms in Abbotsford emit an estimated 638 tonnes of ammonia, resulting in an equivalent of 3777 tonnes CO2 equivalent GHG emission.
Increased concern about the pollution effects of ammonia emission from agriculture has led to considerable research since the mid-90s. Management of manure is important because 75% of the nitrogen fed to our cows ends up in the manure. Of that 75%, ammonia emission on large dairy farms in Abbotsford was estimated to be 42% of the total nitrogen excreted, or 48 kg N per cow per year, based on a nitrogen management model created in the early 1990s (Brisbin 1994). Significant ammonia losses occur in the barn following manure excretion, and during manure storage.
It appears that the 1994 estimate was very close to more recent estimates. Using a modelling approach, Sheppard et al. (2011) estimated ammonia emission losses to be 46 kg N per cow per year on dairy farms in southcoastal British Columbia.
The 1994 model assumed N excretion rates of 116 kg/dairy cow/year (Brisbin 1994). An estimated 15% of the excreted N was emitted as ammonia from the free stall barns, 10% during storage in manure pits, 5% following spreading if incorporated immediately, and 20% if not incorporated.
Based on this information, dairy farms in Abbotsford in 1991 excreted 1369 tonnes of N, of which 1069 tonnes went to manure storage, and 746 tonnes was available for the crop. Ammonia emissions were 177 tonnes from dairy cow housing, 26 tonnes from animal housing yards, 120 tonnes during storage and 246 tonnes following manure application to the fields.
More recent research allow us to provide better estimates of ammonia emissions from our dairy farms in Abbotsford. One obvious error in the 1994 model was that we estimated consistent ammonia emission rates during the year, whereas we now know that ammonia emission increases with increasing temperature.
Nitrogen Excretion Rates per Cow
The N excretion rate of 116 kg N per cow per year may not reflect changes in genetics and higher milk production per cow. Sheppard et al. (2011) provided a review of nitrogen excretion rates per cow per year. In their modelling of ammonia emissions, they used a nitrogen excretion rate of 160 kg N per cow per year using an average diet containing 15.9% crude protein. Nennich et al. (2005) also reviewed the literature and developed a model for N excretion by dairy cattle. They reported N excretion rates of 179 kg N per lactating cow per year when fed 25 kg dry matter per day with a protein content of 17.5%.
In British Columbia, Dinn et al. (1998) reported N excretion rates of 154 and128 kg N/cow per year from dairy cows fed TMR diets consisting of grass silage, corn silage and grain. Crude protein content of these diets were 18.3 and 16.7%, respectively. Groff and Wu (2005) measured manure N excretion rates of 176 to 208 kg N per cow per year with dairy cattle fed alfalfa/corn silage diets ranging from 15 to 18.75 % protein.
The 160 kg N per cow per year for lactating cows suggested by Sheppard et al. (2011) appears to be a realistic number to use for N excretion rates for dairy cattle.
Nitrogen Excretion from Dairy Cows in Abbotsford
Using the N excretion rates from Sheppard et al. (2011) for lactating dairy cows, dry dairy cows, dairy calves and dairy heifers, we can calculate the N excretion from the 13,886 dairy cows (average N excretion of 148 kg N/cow/year to account for lactating an non-lactating cows) and 6,377 replacement cattle (average N excretion of 35 kg N/animal/year) in Abbotsford (Census of Agriculture 2011).
The estimated N excretion from dairy cattle in Abbotsford is 2,282 tonnes of actual N per year in 2011, which is 66% or 913 tonnes higher than the estimates provided for 1991 (Brisbin 1994).
Ammonia Emission from Animal Housing
In the 1994 nutrient cycling model, 15% of the excreted nitrogen was lost as ammonia consistently throughout the year (Brisbin 1994). We now know that ammonia emission increases with increasing temperature. Rumburg et al. (2008) observed that ammonia emissions were seasonal and ranged from 10 kg NH3/day in the winter to over 80 kg NH3/day in the summer from 185 milking cows (20 to 160 kg N per cow per year).
In a report for the US EPA, Battye et al. (1994) estimated an emission rate of 40 kg NH3 per dairy cow per year. Hristov et al. (2011) summarized 27 research reports on ammonia emission from dairy barns. The overall average emission was 59 g N/cow/day, or 21.5 kg N per cow per year, or 14.5% of a total of 148 kg N excreted per cow per year. They noted that emissions ranged from 0.3 to 90 kg N per cow per year. They noted that ammonia losses from dairy manure are expected to be greater at higher ambient temperatures and wind speed, in open-lot facilities, in buildings allowing instantaneous mixing of uring and feces, and with higher protein diets. They measured a 25% loss of excreted N as ammonia from a free stall dairy barn over a one year period in Pennsylvania.
Hollman et al. (2008) measured N intake, milk and manure production in a free stall dairy barn that was flushed 4 times per day in Virgina during a one year period. The manure excretion rate was 170 kg N per cow during the year, with 67.5 or 39% of the manure N unaccounted for immediately after flushing.
In Washington state, Rumburg et al. (2008) concluded that 40 kg N/cow/year or 22% of the 180 kg N per cow per year excreted was volatilized as ammonia in a free stall dairy barn.
Paul et al. (1998) measured up to 38% loss of total nitrogen excreted by dairy cattle under simulated conditions of a barn floor during a 24 hour period at 25 C. The ammonia emission was directly correlated with ammonium concentration in the manure, and was also correlated with the protein intake by the dairy cows. It is important to note that there was no mixing or disturbance of manure during this period as would be found in a typical dairy barn with cattle movement.
Based on recent research, I conclude that ammonia emissions from dairy barns in Abbotsford are more likely to average 20 to 25% of the N excreted. Therefore, of the 2282 tonnes of N excreted by dairy cows in Abbotsford, assuming a 20% loss as ammonia, the total ammonia emission is 456 tonnes per year.
It would be interesting to see if there is any work on ammonia emission from free stall dairy barns where the manure solids are recycled for bedding. I would expect ammonia emissions to be significantly higher than barns that use sawdust for bedding.
Ammonia Emission During Storage and Following Application to the Field
The 1994 nitrogen management model suggested a 10% loss of total nitrogen during storage, a 5% loss following field application if incorporated immediately, or a 20% loss if not incorporated (Brisbin 1994). Given these estimates, the greatest losses of ammonia occur in the animal housing. Ammonia emission from manure storages in Abbotsford are estimated to be 182 tonnes per year compared with the 456 tonnes from animal housing. If we assume an average of the 5% and 20% losses following manure application, we have a total of 205 tonnes of ammonia emitted following field application.
It does not appear that these numbers would change significantly. What may change is the timing, because with larger manure storage tanks, more manure is being applied in the early spring. Bittman et al. (2010) measured the highest ammonia emission rates in the lower Fraser Valley during May, which coincides with the time that most manure is being applied to the land.
Ammonia Emission Contributes to Nitrous Oxide Emission
The Intergovernmental Panel for Climate Change guidelines recommended including ammonia emissions in greenhouse gas calculations. The estimated the indirect effect of NH3 emission on nitrous oxide production to 2% (IPCC 2006). Given the estimates of 456 tonnes per year of ammonia emission from animal housing, and 182 tonnes per year from storage and land application, and given that the carbon dioxide equivalent of nitrous oxide is 296 times, we have a total of 3777 tonnes of CO2 equivalent greenhouse gas emissions resulting from ammonia emissions in dairy barns. We can use this number later in estimates of greenhouse gas emissions from agriculture in Abbotsford.
References
Battye, R. W. Battye, C. Overcash and S. Fudge. 1994. Development and selection of ammonia emission factors. Final report for US EPA.
Bittman, S., J. Tait, D. Hunt, S. Sheppard, K. Chipperfield and Q. Zheng. 2010. Ammonia emission inventory for farms in the Lower Fraser Valley with detailed spatial and temporal resolution. 15th International Union of Air Pollution Prevention and Environmental Protection Associations’ World Clean Air Congress, Vancouver, BC Sept 2010. http://events.awma.org/IUAPPA/presentations/5D/a151.pdf
Brisbin, P.E. 1997. Agricultural Nutrient Management in the Lower Fraser Valley. DOE FRAP 1995-27. Environment Canada.
Dinn, N.E., J.A. Shelford and L.J. Fisher. 1998. Use of the Cornell Net Carbohydrate and Protein System and rumen protected lysine and methionine to reduce nitrogen excretion from lactating dairy cows. Journal of Dairy Science 81: 229-237.
Groff, E.B. and Z. Wu. 2005. Milk production and nitrogen excretion of dairy cows fed different amounts of protein and varying proportions of alfalfa and corn silage. Journal of Dairy Science 88: 3619-3632.
Hollman, M., K.F. Knowlton and M.D. Hanigan. 2008. Evaluation of solids, nitrogen, and phosphorus excretion models for lactating dairy cows. Journal of Dairy Science 91: 1245-1257.
Hristov, A.N., M. Hanigan, A. Cole, R. Todd, T.A. McAllister, P. Ndegwa and A. Rotz. 2011. Review: Ammonia emissions from dairy farms and beef feedlots. Canadian Journal of Animal Science 91: 1-35.
IPCC. 2006. 2006 IPCC Guidelines for National Greenhouse Gas Inventories. Volume 4. Agriculture, Forestry and Other Land Use. Chapter 10. Emissions from Livestock and Manure Management. http://www.ipcc-nggip.iges.or.jp/public/2006gl/pdf/4_Volume4/V4_10_Ch10_Livestock.pdf
Nennich, T.D., J.H. Harrison, L.M. Van Wieringen, D. Meyer, A.J. Heinrichs, W.P. Weiss, N.R. St-Pierre, R.L. Kincaid, D.L. Davidson and E. Block. 2005. Prediction of manure and nutrient excretion from dairy cattle. Journal of Dairy Science 88: 3721-3733.
Paul, J.W., N.E. Dinn, T. Kannangara and L.J. Fisher. 1998. Protein content in dairy cattle diets affects ammonia losses and fertilizer nitrogen value. Journal of Environmental Quality 27: 528-534.
Rumburg, B., G.H. Mount, J. Filipy, B. Lamb, H. Westberg, D. Yone, R. Kincaid and K. Johnson. 2008. Measurement and modeling of atmospheric flux of ammonia from dairy milking cow housing. Atmospheric Environment 42: 3364-3379.
Sheppard, S.C., S. Bittman, M.L. Swift and J. Tait. 2011. Modelling monthly NH3 emissions from dairy in 12 Ecoregions of Canada. Canadian Journal of Animal Science 91: 649-661.
In addition to nitrous oxide emission from agriculture as a greenhouse gas that affects climate change, ammonia is considered an indirect pollutant. The next few posts will review ammonia volatilization from our agricultural production because not only is ammonia emission a loss of nitrogen from our agriculture, it has potentially negative health effects, and adds to our greenhouse gas emissions.
The indirect effect of ammonia emission is greater than direct N2O emission from soil
IPCC (1996) determined that the direct N2O emissions from N applied to soil is 1%, and the indirect N2O emissions from NH3 volatilization is 1.6%. The IPCC (2006) guidelines increased the indirect effect of NH3 emission to 2%. We need a greater understanding of ammonia emission, in order to develop strategies to reduce it.
Initial concerns with ammonia emission were not related to N2O emission
The initial worldwide effort to reduce ammonia emissions from agriculture in the 1980s was not related to greenhouse gas emissions, but more about air quality and other ecosystem effects.
Schmidt and Mosel (2007) stated that ammonia emissions rank among the most important substances polluting the ecosystems. Germany concluded that 95% of ammonia emissions came from agricultural sources in 2001, of which 82% came from animal husbandry. Switzerland reported that 90% of ammonia emissions resulted from agriculture already in the early 1990s (Reidy et al. 2008). The US National Research Council estimated that 65% of all NH3 emissions from terrestrial systems come from animal farming systems.
When I lived in the Netherlands for part of my education on manure in the late 1980s, our two year old daughter often exclaimed as we drove out of our village “smells like poop here, Dad”. The Netherlands had been conducting research and implementing regulation to reduce ammonia from agriculture since the early 1980s. The main reason for this was forest dieback in eastern Europe.
As a result, the Environmental Management Act in the Netherlands required all liquid manure storages to be covered in 1987 to reduce ammonia emissions. In 1994, manure application techniques to reduce ammonia emission were implemented. The Gotenburg Protocol (1999) was signed in Europe in 1999, whereby the member countries agreed to reduce ammonia emissions by 17% by 2010 (Netherland’s reduction target was 43%!). Erisman et al. (1998) reported that ammonia emission reduction from agriculture is not as easy to achieve as was predicted.
Ammonia is considered a pollutant in the Fraser Valley. It has been linked with the white haze and the formation of small particulate matter. Belzer et al. (1996) measured actual nitrogen deposition of 42.5 kg N per hectare resulting from ammonia emission in Abbotsford during a portion of the growing season. Environment Canada (1996) estimated that 7600 tonnes of ammonia N were emitted from agriculture in the Lower Fraser Valley of BC. Bartholomie and Pryor (1998) demonstrated that ammonia mixed with sulphur oxides to form the white haze sometimes seen in the Fraser Valley. Giroux et al. (2002) determined that the primary source of ammonia was from agriculture in the Fraser Valley. Bittman et al. (2010) identified the dairy sector as a primary source of ammonia emissions in the Fraser Valley.
Foyle (2011) identified ammonia emission as one of the primary air quality concerns in the Fraser Valley, both because of its role in fine particulate formation resulting in human health concerns, its role in the white haze, and its role in N deposition. They cited a 2005 report suggesting that 76% of the ammonia emissions resulted from agriculture. Indirect emissions of GHG due to ammonia redeposition was not considered in this report.
IPCC (2006) recommends including ammonia emission as a source of N2O. For example, Skiba et al. (2005) reported that 3% of the volatilized ammonia was emitted as N2O following deposition around poultry farms. Veldhof et al. (2009) did not include anaerobic digestion in their modelling scenarios for ammonia emission abatement in Western Europe. Petersen and Sommer (2011) concluded that anaerobic digestion of animal manure would increase ammonia emission, based on their extensive work on manure management in Denmark and their understanding of the science of manure. In a review of the literature, Hoeksma et al. (2012) concluded that digested manure contains higher ammonium concentration and a higher pH, which means that higher ammonia losses would be expected during both storage and following field application. Anaerobic digestion was not cited as a strategy for ammonia emission.
Ammonia emission is not necessarily affected by improving our nitrogen use efficiency on farms. In the following posts, we will consider ammonia emission on poultry and dairy farms more in depth. It does appear to be a significant but indirect contributor to climate change.
This suggests that we should be considering this in our community as we develop our Agriculture Strategy and our Agricultural Waste Policies and recommendations.
References
Barthelmie, R.J., and S.C. Pryor. 1998. Implications of ammonia emission for find aerosol formation and visibility impairment: a case study from the lower fraser valley, British Columbia. Atmospheric Environment 32: 345-352.
Belzer, W., C. Evans and A. Poon. 1997. Atmospheric nitrogen concentrations in the Lower Fraser Valley. Environment Canada DOE FRAP 1997-23
Bittman, S., J. Tait, D. Hunt, S. Sheppard, K. Chipperfield and Q. Zheng. 2010. Ammonia emission inventory for farms in the Lower Fraser Valley with detailed spatial and temporal resolution. 15th International Union of Air Pollution Prevention and Environmental Protection Associations’ World Clean Air Congress, Vancouver, BC Sept 2010. http://events.awma.org/IUAPPA/presentations/5D/a151.pdf
Environment Canada. 1996. Management of Agricultural Wastes in the Lower Fraser Valley. Summary Report No. 9. DOE FRAP 1996-30
Erisman, J.W., A. Bleeker and J.A van Jaarsveld. 1998. Evaluation of ammonia emission abatement on the basis of measurements and model calculations. Environmental Pollution 102 S1 269-274.
Foyle, J. 2011. Air Quality Framework for BC Agriculture. http://www.fvrd.bc.ca/InsidetheFVRD/MeetingsAgendasMinutes/ExecutiveCommittee/Archived%20Agendas/2011%2003%2008%20Executive%20Committee/Item%2007-01%202-Air%20Quality%20Framework%20for%20BC%20Agriculture%20-Dec%2021%202010%20-Final.pdf
Giroux, E., H. Roth, D. Yin and W. Jiang. 2002. Modelling and processing ammonia emissions for particulate matter studies in the Lower Fraser Valley. 11th International Emission Inventory Conference, Atlanta, GA April 2002. http://www.epa.gov/ttnchie1/conference/ei11/ammonia/giroux.pdf
Gotenburg Protocol. 1999. Protocol to the 1979 convention on long range transboundary air pollution to abate acidification, eutrophication and ground level ozone. http://www.unece.org/fileadmin/DAM/env/lrtap/full%20text/1999%20Multi.E.Amended.2005.pdf
IPCC. 1996. Module 4. Agriculture. 2006 IPCC Guidelines for National Greenhouse Gas Inventories.
IPCC. 2006. 2006 IPCC Guidelines for National Greenhouse Gas Inventories. Volume 4. Agriculture, Forestry and Other Land Use. Chapter 10. Emissions from Livestock and Manure Management. http://www.ipcc-nggip.iges.or.jp/public/2006gl/pdf/4_Volume4/V4_10_Ch10_Livestock.pdf
Hoeksma, P., J. Mosquera and R.W. Melse. 2012. Monitoring methane and nitrous oxide reduction by manure treatment. Report 627. Livestock Research, Wageningen UR, the Netherlands.
Petersen, S.O. and S.G. Sommer. 2011. Ammonia and nitrous oxide interactions: roles of manure organic matter management. Animal Feed Science and Technology 166-167: 503-513.
Reidy, B., B. Rhim, and H. Menzi. 2008. A new Swiss inventory of ammonia emissions from agriculture based on a survey on farm and manure management and farm-specific model calculations. Atmospheric Environment 42: 3266-3276.
Schmidt, R., and R. Mosel. 2007 Reduction of ammonia-emissions at farm level – a decision between environmental and animal protection? In Reduction of Greenhouse Gas Emissions at Farm and Manufacturing Levels. Bulletin of the International Dairy Federation 422/2007
Skiba, U., J. Dick, R. Storeton-West, S. Fernandez-Lopez, C. Wood, S. Tang and N. Van Dijk. 2005. The relationship between ammonia emissions from a poultry farm and soil NO and N2O fluxes from a downwind source. Biogeosciences Discussions 2: 977-995.
Veldhof, G.L., D. Oudendag, H.P. Witzke, W.A.H. Asman, Z. Klimont and O. Oenema. 2009. Integrated assessment of nitrogen losses from agriculture in EU-27 using MITERRA-EUROPE. Journal of Environmental Quality 38: 402-417.
In the Abbotsford Agricultural Waste Strategy (on this blog), we identified one of the solutions for a sustainable agriculture is to develop “strategies to reduce ammonia and greenhouse gas emissions from agriculture through incentives or tax reduction”.
In the last post, we identified nitrous oxide as the most significant greenhouse gas emitted from agriculture (40-50% of greenhouse gas emission), and recommended implementing mandatory nutrient management planning as being the strategy that has the greatest potential for mitigation.
In this post, we will review the science and microbiology of nitrous oxide production and emission, so we can better understand how implementing a nitrogen management planning process will reduce GHG emissions.
Nitrous oxide has the radiative forcing 296 times that of carbon dioxide, which means that it doesn’t take much of this gas to have a big effect on greenhouse gas contributions. Crutzen (1970) was one of the first scientists to link nitrous oxide with ozone depletion. He also connected it with fertilizer use.
“Over the past 100,000 years, concentrations of nitrous oxide in the atmosphere have rarely exceeded 280 ppb. Levels have risen since the 1920s, however, reaching a new high of 324 ppb in 2011. This increase is primarily due to agriculture.” (US EPA 2012)
Davidson (2009) analyzed trends in atmospheric nitrous oxide concentrations and concluded the following: “Before 1960, agricultural expansion, including livestock production, may have caused globally significant mining of soil nitrogen, fuelling a steady increase in atmospheric nitrous oxide. After 1960, the rate of the increase rose, due to accelerating use of synthetic nitrogen fertilizers. Using a regression model, I show that 2.0% of manure nitrogen and 2.5% of fertilizer nitrogen was converted to nitrous oxide between 1860 and 2005; these percentage contributions explain the entire pattern of increasing nitrous oxide concentrations over this period.”
Park et al. (2011) used naturally occuring 15N to distinguish between natural and anthropogenic sources of nitrous oxide, and confirmed that increased atmospheric nitrous oxide concentrations is primarly due to increased use of nitrogen-based fertilizer.
Nitrous oxide is a greenhouse gas that is important to consider in agriculture in Abbotsford for three reasons.
1. Nitrous oxide “leakage” in the nitrogen cycle can’t be avoided.
2. Nitrous oxide emission occurs during nitrification – the conversion of ammonium to nitrate, a microbially mediated process in the presence of oxygen in soil amended with manure or fertilizer, in soil following deposition of ammonia, or in surface waters contaminated with ammonium (IPCC 2007) .
3. Nitrous oxide emission occurs during denitrification – the conversion of nitrate back to atmospheric N2, a microbially mediated process in the absence of oxygen in soil or manure, following manure or fertilizer application to the field, or in surface or groundwater contaminated with nitrate (IPCC 2007).
Nitrous Oxide Emission Naturally Occurs as Part of the Nitrogen Cycle
The best way to understand the importance of nitrous oxide is to show it using a simplified nitrogen cycle.
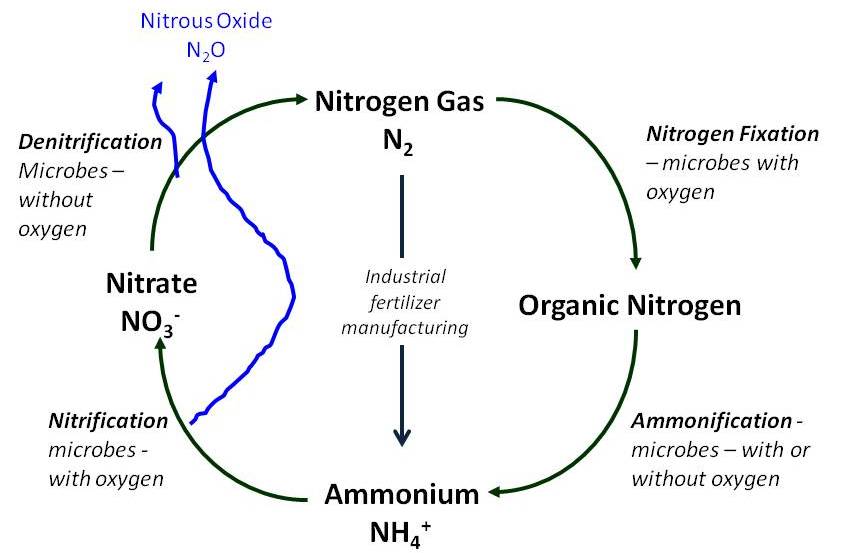
Simplified nitrogen cycle showing where nitrous oxide emission occurs.
All of the nitrogen fixed from the atmosphere either through fertilizer manufacture, N fixation by legumes, or nitrate production by lighting enters the nitrogen cycle is returned to the atmosphere via a process called denitrification. There is significant nitrogen cycling within this simplified cycle, especially between organic nitrogen, ammonium and nitrate. As we can see from the diagram above, nitrous oxide emission occurs during internal cycling as well, during the transformation from ammonium to nitrate. This process is called nitrification.
Nitrous Oxide is Emitted During Denitrification
Denitrification is defined as the “mircobial reduction of nitrate or nitrite to gaseous nitrogen, either as molecular nitrogen or as an oxide of nitrogen” (Soil Science Society of America 1979). When nitrous oxide was first considered an important greenhouse gas, it was considered that denitrification was the main contributor because N2O was a known intermediate gas in the microbially mediated denitrification process. The final product of denitrification is atmospheric nitrogen, which represents the final step in the nitrogen cycle.
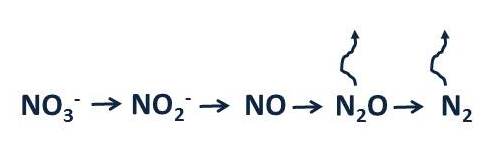
Nitrogen species change from nitrate to dinitrogen during denitrification, showing nitrous oxide as an intermediate.
The amount of N2O emitted during denitrification depends on process conditions. There are three key factors required for denitrification to occur.
1. Nitrate (NO3-) needs to be present
2. Denitrifying bacteria require a carbon source as an energy source
3. No oxygen (O2) present, otherwise the microbes use O2 as the electron acceptor
Nitrous Oxide is Emitted During Nitrification
Nitrification is the biological conversion of reduced nitrogen in the form of ammonia or ammonium to organic N or oxidized N in the form of nitrate or nitrite (Norton and Stark 2011). The understanding that nitrous oxide emission could occur as a result of nitrification was relatively recent (Bremner and Blackmer 1981). The contribution of nitrification to total nitrous oxide emission appears to be increasing. Park et al. (2011) distinguished that the relative contribution of nitrification to global microbial N2O production increased from 13% in 1750 to 23% in 2005.

Intermediates in the nitrification pathway from ammonium to nitrate, showing where nitrous oxide is emitted.
There are two primary conditions that are required for nitrification to occur.
1. Nitrifying bacteria require oxygen
2. Ammonium must be present, which is used as an energy source by the bacteria.
In addition, nitrification is signficantly reduced at temperatures greater than 40 C.
Nitrous oxide emission has also been reported via a process known as heterotrophic nitrification, where the nitrifying bacteria utilize carbon as their energy source (Norton and Stark 2011). Cai et al. (2010) reported that heterotrophic nitrification increased with increasing carbon availability. Paul et al. (1993) also measured increased nitrous oxide emission during nitrification when additional carbon was added to the soil. Poth and Focht (1985) also introduced the concept of nitrifier denitrification, where heterotrophic nitrifiers are able to first oxidize ammonia to nitrite, then reduce the nitrite to dinitrogen, with nitrous oxide as the intermediate product. It is important to note that in the nitrifier denitrification process, the first step is an oxidative step and hence requires oxygen.
Addition of carbon does two things, both of which may increase potential nitrous oxide emission. The first is that it provides readily available carbon which may increase heterotrophic and denitrifier nitrification, and it also increases oxygen demand, which increases the potential for anaerobic microsites in manure, compost or soil. This was also concluded by Petersen and Sommer (2011) where they state: “Readily degradable components serve as an O2 sink, as well as a C and energy source for heterotrophic denitrification at oxic-anoxic interfaces”
There appears to be a number of controlling factors that have been suggested for the amount of N2O emitted during nitrification. They include:
1. Oxygen supply – which may include anaerobic microsites
2. Carbon supply – which feeds heterotrophic nitrifiers and reduces oxygen supply (Sommer et al. 2004)
3. Carbon supply – which changes microbial population in favor of heterotrophic nitrifiers (Paul et al. 1993).
4. Ammonia concentration – increases N2O emissions due to higher N cycling rates (Hwang et al. 2006)
It appears that all of the above factors are important. The fourth factor – the carbon ammonium ratio appears to be contradictory to the second and third, however, it appears that the carbon/ammonium ratio is controlled more by the ammonium concentration in this case. In some preliminary research, I measured N2O emissions from dairy cattle manure that had been fed diets varying in protein and found that N2O emissions from the dairy cattle manure amended to soil was correlated with the ammonium concentration in the manure (unpublished data).
Manure application to soil creates ideal conditions for N2O emission:
1. the soil oxygen supply is reduced because soil pores are blocked and oxygen in the soil is used up by the microbes feeding on the carbon in the manure.
2. the manure provides carbon for microbes that reduces the oxygen content in soil and supplies food for the denitrifying bacteria.
3. the manure contains ammonium, part of which is converted to N2O as a byproduct of nitrification to soil nitrate.
Excess manure application (more application than is needed by the crops) is of concern because it enhances the conditions for N2O emission. Given that N2O emission comprises 40-50% of GHG emissions from animal agriculture, the most likely and potentially achievable strategy to reduce greenhouse gas emissions from animal agriculture is to implement mandatory nutrient management planning.
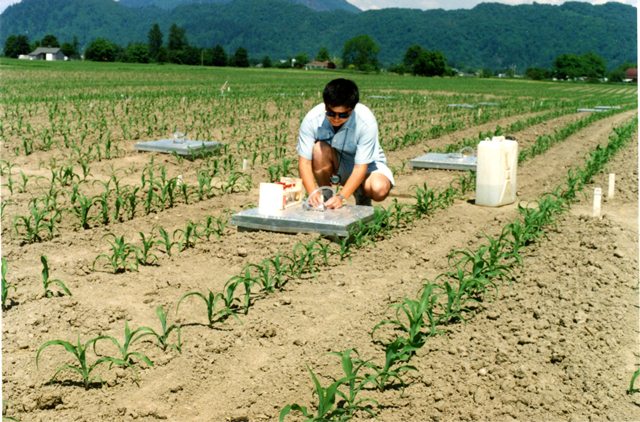
We measured N2O emission from manured soils at Agriculture and Agri-Food Canada in 1996.
References
Alinsafi, A., N. Adouani, F. Beline, T. Lendormi, L. Limousy and O. Sire. 2008. Nitrite effect on nitrous oxide emission from denitrifying activated sludge. Process Biochemistry 43: 683-689.
Bremner, J. M. and A. M. Blackmer. 1981. Terrestrial nitrification as a source of atmospheric nitrous oxide. In. C.C. Delwiche, ed., Denitrification, nitrification and atmospheric nitrous oxide. pp 151-170. John Wiley & Sons, New York.
Cai, Y., W. Ding, X. Zhang, H. Yu and L. Wang. 2010. Contribution of heterotrophic nitrification to nitrous oxide production in a long-term N-fertilized arable black soil. Communications in Soil Science and Plant Analysis 41: 2264-2278.
Crutzen, P. J. 1970. The influence of nitrogen oxides on the atmospheric ozone content, Q. J. Roy. Meteor. Soc. 96: 320–325.
Davidson, E.A. 2009. The contribution of manure and fertilizer nitrogen to atmospheric nitrous oxide since 1860. Nature Geoscience 2. 659-662.
Hwang, S., H. Jang, H. Jang, J. Song and W. Bae. 2006. Biodegradation 17: 19-29.
IPCC (Intergovernmental Panel on Climate Change). 2007. Climate change 2007: Synthesis report (Fourth Assessment Report). Cambridge, United Kingdom: Cambridge University Press.
Leip, A., F. Weiss, T. Wassenaar, I. Perez, T. Fellmann, P. Loudjani, F. Tubiello, D. Grandgirard, S. Monni, and K. Biala. 2010. Evaluation of the livestock sector’s contribution to the EU greenhouse gas emissions (GGELS) –final report. European Commission, Joint Research Centre.
Norton, J.M. and J. M. Stark. 2011. Regulation and measurement of nitrification in terrestrial ecosystems. Chapter 15 in. M.G. Klotz, ed. Methods in Enzymology. Vol 486. 343-368.
Park, S., P. Croteau, K.A. Boering, D.M. Etheridge, D. Ferretti, P.J. Fraser, K-R Kim, P.B. Krummel, R.L. Langenfelds, T.D. van Ommen, L.P. Steele and C.M. Trudinger. 2012. Trends and seasonal cycles in the isotopic composition of nitrous oxide since 1940. Nature Geoscience 5: 261-265.
Paul, J.W., E.G. Beauchamp and X. Zhang. 1993. Nitrous and nitric oxide emissions during nitrification and denitrification from manure-amended soil in the laboratory. Can. J. Soil Sci. 73: 539-553.
Petersen, S.O. and S.G. Sommer. 2011. Ammonia and nitrous oxide interactions: roles of manure organic matter management. Animal Feed Science and Technology 166-167: 503-513
Poth, M. and D.D. Focht. 1985 15N kinetic analysis of N2O production by Nitrosomomas europea: An examination fo nitrifier denitrification. Applied and Environmental Microbiology 49: 1134-1141.
Sabalowsky, A.R. 1999. Complex industrial wastewater with high seasonal temperatures. MSc Thesis. Virginia Polytechnic Institute.
Soil Science Society of America, Terminology Committees. 1979. Glossary of Soil Science Terms. Rev. ed. Soil Sci. Soc. Am.
Sommer, S.G., S.O. Petersen and H.B. Moller. 2004. Algorithms for calculating methane and nitrous oxide emissions from manure management. Nutrient Cycling in Agroecosystems 69: 143-154.
US EPA. 2012. Atmospheric Concentrations of Greenhouse Gases.
In developing an agricultural waste strategy for our communities, strategies to reduce greenhouse gas emissions, particularly nitrous oxide emissions, are important. Of the greenhouse gases, nitrous oxide from farmland following manure and fertilizer addition is the greatest contributor to greenhouse gas emissions from animal agriculture.
Too much nitrogen on the farm increases nitrous oxide emissions – a potent greenhouse gas. In Europe, the priority for agricultural sustainability is to utilize the fertilizer potential of manure and slurry more efficiently (Pedersen 2009). They summarized the measures to reduce the risk of nitrogen and phosphorous leaching or run-off from farming practices in Europe as part of the Nitrates Directive, which also reduces the amount of nitrous oxide emission. Their recommendations are:
1. Respect periods when land application of fertilizers (or manure) is inappropriate or prohibited.
2. Consider the capacity and construction of manure storages.
3. Limit fertilizer application.
4. Respect the EU limit of 170 kg N per hectare per year from livestock manure.
5. Consider land application of fertilizers to steeply sloping ground.
6. Limit land application of fertilizers to water saturated, flooded, frozen or snow covered ground.
7. Limit application of fertilizers near water courses.
8. Develop procedures for land application.
9. Consider land use management, including the use of crop rotations and the proportion of land area devoted to permanent crops.
10. Maintain a minimum quantity of vegetation cover during rainy periods.
11. Establish fertilizer plans on a farm by farm basis.
12. Avoid excessive irrigation that may move nutrients below the root zone
Surplus Nitrogen Increases Nitrous Oxide Emission – a potent greenhouse gas.
In a review, Snyder and Fixen (2012) summarized it well in saying
“poorly managed, imbalanced, and inefficient agricultural N use impairs the ability to provide food, feed, fiber and biofuel; raises the risks for N loss to groundwater and surface water resources; and increases the potential for direct and indirect emissions of the potent GHG, N2O.” and “N2O emissions generally increase with increasing N inputs but usually do not increase markedly (nonlinearly) until the applied N inputs appreciably exceed crop N uptake”
In a literature review, Van Kessel et al. (2009) reported that when N2O emissions were calculated relative to plant yield, N2O emissions increased substantially when more N was applied than could be utilized by the crop (N surplus).
A nitrogen surplus at the farm level is defined by the sum of the total N excretion by animals on the farm plus nitrogen fertilizer minus the amount of nitrogen taken up by the crop (Fontein et al. 1999). Velthof and Oenema (1997) modelled N2O emissions on three dairy farms in the Netherlands and N2O emission was related to N surplus. Using computer modelling, they predicted up to 50% decrease in direct and indirect N2O emission in dairy farming in the Netherlands by improving animal diets and managing manure to optimize nitrogen use. Kuikman et al. (2004) concluded that management measures to improve N use efficiency would be the best strategy to reduce N2O emissions from agriculture. They suggested that implementing cost effect measures would reduce N2O emission by up to 40%.
Olesen et al. (2006) found a linear increase in N surplus with increasing livestock density and that N2O emissions increased with increasing N surplus on dairy farms in Europe. Much of the N2O emission resulted from indirect sources such as N leaching. They concluded that increasing N use efficiency on dairy farms from 12.5% up to 25% would decrease GHG emissions per kg of milk by 50%. Petersen et al. (2006) measured N2O emissions from soils on dairy farms in five European countries and concluded that the nitrous oxide emission was correlated with N input on the farm, and that 1.6% of the total N input to the cropping system was emitted as N2O. They found that ammonium, not nitrate, was related to N2O emissions.
Field Application of Manure is a Significant Contributor to Nitrous Oxide Emission
There are some excellent reviews on N2O emission from soil following manure application (Vanderzwaag et al. 2011, Chadwick et al. 2011, and Webb et al. 2010). Some of the main manure management factors that affect N2O emission include:
1. manure application rate – manure applied at higher rates are more likely to create anaerobic pockets or microsites in soil where N2O emission is higher. Some research suggests that N2O increase is logarithmic with increased application rates
2. manure application method – it appears that injection may increase N2O emission, however, this may be more related to lower NH3 losses and hence greater N availability. Webb et al. (2010) suggested that the slightly greater N2O emission is offset by less indirect N2O emission resulting from NH3 emission as well as greater N use efficiency by the plant.
3. amount of solids in manure – there are mixed reports on whether a change in solids content of manure increases or decreases N2O emission. Manures with lower solids content and similar ammonium contents may result in lower N2O emission because the manure is less likely to result in anaerobic microsites. Sometimes the opposite may be true in that manures with higher solids content may result in higher NH3 emissions and lower N2O emissions. Sometimes more dilute manures may increase soil moisture content, hence increasing N2O emission.
4. soil type – heavier textured soils typically hold more water and result in higher N2O emission rates
5. soil conditions – manure application rates during periods when the soil is more likely to have a higher moisture content will result in higher N2O emission.
6. ammonium concentration in the manure – N2O emission rates are more correlated with available ammonium in manure than total N.
Although modelling N2O emission reduction from soil focuses on the carbon in the manure and its effect on soil oxygen content (Sommer et al. 2004), total N management has a major role. Strategies to reduce N2O emission from manure applied to soil are centered mostly around increasing the efficiency of nitrogen use for crop production. “If nitrogen applications were better matched to plant growth, then the efficiency of nitrogen fertilization would increase and nitrous oxide emissions would reduce.” (Russell et al. 2007).
Considering that nitrous oxide is the greenhouse gas that comprises 40 to 50% of the greenhouse gas emissions from animal farms, strategies to manage this emission is most likely to make a difference. The second greatest contributor to agricultural greenhouse gas emission is enteric methane emission (from the cow’s stomach), but is much more difficult to reduce.
In the next post, we will explain some of the science of nitrous oxide production and emission, in order to help us understand how to reduce emissions.
References
Alterra. 2011. Farming practices in relation to water pollution risks: Recommendations for establishing Action Programs under Directive 91/676/EEC concerning the protection of waters against pollution caused by nitrates from agricultural sources (ND-Act). Alterra, Wageningen-UR. Wageningen. 123 pp.
Chadwick, D., S. Sommer, R. Thornman, D. Fangueiro, L. Cardenas, B. Amon and T. Misselbrook. 2011. Manure management: implications for greenhouse gas emissions. Animal Feed Science and Technology 166-167: 514-531.
Fontein, P.F., G.J. Thijssen and J.R. Magnus. 1999. Optimal taxation for the reduction of nitrogen surplus in Dutch dairy farms 1975-1989. Chapter 12 in S. Mahendraraja et al., Modelling Change in Integrated Economic and Environmental Systems.
Kuikman, P.J., G.L. Velthof, and O. Oenema. 2004. Controlling nitrous oxide emissions from agriculture: experience from the Netherlands. In D.J. Hatch et al., eds., Controlling Nitrogen Flows and Losses. 12th Nitrogen Workshop, Wageningen Academic Publishers, University of Exceter, UK.
Olesen, J.E., K. Schelde, A. Weiske, M.R. Weisbjerg, W.A.H. Asman, J. Djurhuus. 2006. Modelling greenhouse gas emissions from European conventional and organic dairy farms. Agriculture, Ecosystems and Environment 112: 207–220
Petersen, S.O. K. Regina, A. Pollinger, E. Rigler, L. Valli, S. Yamulki, M. Esala, C. Fabbri, E. Syvasalo and F.P. Vinther. 2006. Nitrous oxide emissions from organic and conventional crop rotations in five European countries. Agriculture, Ecosystems and Environment 112: 200–206.
Petersen, J.A. 2009. Reducing Greenhouse Gas Emissions from Livestock – A European Perspective. Feeding a Hot and Hungry Planet. Princeton University. April 29- May 1, 2009
Russell, J.M., J.W. Barnett, E. Desilets and S. Bertrand. 2007. Mitigation strategies to reduce GHG Emission from the dairy industry. pp. 30-44 in Bulletin of the International Dairy Federation 422/2007. Reduction of Greenhouse Gas Emissions at Farm and Manufacturing Levels.
Sommer, S. G., Petersen, S. O., Moller, H. B., 2004. Algorithms for calculating methane and nitrous oxide emissions from manure management. Nutr. Cycl. Agroecosyst. 69: 143-154.
Snyder, C.S. and P.E. Fixen. 2012. Plant nutrient management and risks of nitrous oxide emission. J. of Soil and Water Conservation 67: 137A-144A.
Van Kessel, C., J.W. Van Groenigen, K.J. Van Groenigen, O. Oenema and G.L. Velthof. 2009. Towards An Agronomic Assessment of N2O Emissions. Footprints in the Landscape: Sustainability through Plant and Soil Sciences. ASA-CSSA-SSSA Annual meetings, Nov 2009, Pittsburg
Vanderzwaag, A.C., S. Jayasundara and C. Wagner-Riddle. 2011. Strategies to mitigate nitrous oxide emissions from land applied manure. Animal Feed Science and Technology 166-167: 464-479.
Velthof, G.L. and O. Oenema. 1997. Nitrous oxide emission from dairy farming systems in the Netherlands. Netherlands Journal of Agricultural Science 45: 347-360.
Webb, J., B. Pain, S. Bittman and J. Morgan. 2010. The impacts of manure application methods on emissions of ammonia, nitrous oxide and on crop response – a review. Agriculture, Ecosystems and Environment 137: 39-46.
Understanding greenhouse gas emissions from agriculture is important in developing an agricultural waste strategy for four primary reasons:
1. The most promising mitigation strategy for reducing greenhouse gas emissions from agriculture is by developing mandatory nutrient management plans, as reducing nitrous oxide emission from soils is the single largest contributor to agricultural greenhouse gas emissions. Nutrient management plans also reduce negative impacts on ground and surface water.
2. Implementing anaerobic digestion to reduce greenhouse gas emissions can easily be overstated as methane emission from manure storage comprises 10% or less of the greenhouse gas emissions from livestock farms.
3. Significant private and public funding is being used to mitigate greenhouse gas emissions from agriculture, therefore it is important to use internationally accepted protocols and to have good science to support it.
4. Ammonia emission from agriculture also increases greenhouse gas emissions via increased nitrous oxide emissions.
The next number of posts will consider the science on greenhouse gas emissions from agriculture in a global perspective, a Canadian perspective, and an Abbotsford perspective. We will include some of the science of the processes involved in order to understand relevance and mitigation strategies.
Global Greenhouse Emissions from Agriculture
Agriculture accounts for 10-12% of the total global emissions of greenhouse gases (Smith et al. 2007). Agriculture accounts for about 60% of the world nitrous oxide emissions, and 50% of the methane emissions. Worldwide, nitrous oxide and methane emissions from agriculture increased 17% from 1990 to 2005. In North America, the main contributor to increasing emissions is management of manure from cattle, poultry and swine production, and manure application to soils.
Worldwide agricultural N2O emissions were projected to increase by 35-60% to 2030 due to increased nitrogen fertilizer use, and increased animal manure production (FAO 2003). Methane emissions are expected to increase by 60% due due to increases in livestock numbers.
The best options to reduce GHG emissions from agriculture include improve crop management, including nutrient use (Smith et al. 2007). They also noted that:
“Agricultural mitigation measures often have synergy with sustainable development policies, and many explicity influence social, economic, and enviornmental aspects of sustainability.”
“Improving N use efficiency can reduce nitrous oxide emisions and indirectly reduce GHG emissions from N fertilizer manufacture. By reducing leaching and volatile losses, improved efficiency of N use can also reduce off-site nitrous oxide emissions.”
Nitrous oxide emission from soil and methane emission from enteric fermentation (emissions from ruminant’s stomachs) represent 70% (38% for nitrous oxide and and 32% for methane) of the non CO2 emissions from agriculture (US EPA 2006). Manure management accounts for 7% of the total nitrous oxide and methane emissions from agriculture.
Gattinger et al. (2011) reported that that nutrient management (optimizing fertilizer and manure application to crop needs, including timing and method of application) would reduce nitrous oxide emissions from soils by 30 to 75%, which is the strategy that provides the greatest opportunity to reduce agricultural GHG emissions.
World Livestock Production is a Significant Contributor to GHG Emissions
Using a Life Cycle Assessment (LCA) approach, FAO (2103) estimated that GHG emissions from the livestock sector worldwide represents 14.5% of human-induced GHG emissions, of which beef production, milk production, pork production, and poultry production contribute 41%, 20%, 9% and 8%, respectively (FAO 2013). These calculations included CO2 emissions from transportation and storage (approximately 20% of total emissions), which was not included in the Smith et al. (2007) calculations. Food production and processing represented 45%, and enteric fermentation from ruminants represented 39%, whereas manure storage and processing represent 10% (4.3% from methane and 5.2% from nitrous oxide).
Canada’s Agricultural GHG Emissions
In 2002, agriculture related GHG emissions contributed 8% of the total national emissions in Canada, and accounted for 65% of Canada’s emissions of nitrous oxide and 26% of the methane emissions (Kebreab et al. 2006). They further noted that domestic animals contribute 32% of Canadian agricultural emissions (primarily CH4 from the stomachs of ruminant animals), 17% from manure management, and 50% from soils (which is mostly nitrous oxide), and concluded that animal agriculture contributes more than 50% of the agricultural greenhouse gas emissions in Canada. Because more than 50% of agriculture’s contribution to greenhouse gas emissions is nitrous oxide from soils, Agriculture and Agri-Food Climate Change Table (2000) identified farm nutrient management plans as a mechanism for optimizing nitrogen applications and a strategy to reduce N2O emissions. Using a LCA approach for the dairy industry in eastern Canada, McGeough et al. (2012) estimated that methane from the rumen accounted for 48% of the GHG emissions, methane from manure was 8%, and nitrous oxide from soils was 40%. Using a farm management model, Biocap (2006) estimated that a 10% reduction in manure application rate resulted in a 28% greater GHG emission reduction.
GHG Emissions from Agriculture in the Fraser Valley
Greenhouse gas emissions from agriculture in the Fraser Valley were calculated for the year 2000 (Levelton 2004). They estimated that 31% of agricultural GHG came from cattle (all methane emissions), 27% from manure (approximately 80% methane, 14% from fertilizer application (all nitrous oxide), and 25% from engines used in agricultural production (as carbon dioxide). Of the total methane emissions, 61% were from livestock and 38% were from animal manure. Of the total nitrous oxide emissions, 29% was from manure, 59% from fertilizers applied to soil, and 12% from non-road engines. They reported that 60% of manure related GHG emission came from poultry manure management(2/3 of that being methane, 1/3 nitrous oxide, and 31% from cattle manure management (98% of this being methane). They also reported 10,000 tonnes of ammonia emission, of which 68% originated from the poultry industry. Ammonia emission is a concern as it also contributes to nitrous oxide emissions when the ammonia is redeposited on the soil or water.
Recommendations for Agriculture in the Fraser Valley
Methane from ruminant animals and nitrous oxide emission from manure and fertilized soils are the greatest contributors to agricultural greenhouse gas emissions. Manipulating animal diets is one approach to reducing methane emissions from the ruminant animal, however so far, the potential mitigation options are limited. One of the most promising strategies for mitigating agricultural GHG is to optimize nitrogen use, which can be managed by implementing nutrient management planning. Worldwide and in Canada, methane emissions from manure are estimated at 10% of the agricultural greenhouse gas emissions, whereas the estimate in the Lower Fraser Valley was approximately 25%. If 25% of our agricultural GHG emissions resulted from manure management, perhaps anaerobic digestion may be a good strategy for GHG mitigation as well.
In future posts we will address some of the strategies to reduce greenhouse gas emissions from agriculture. This involves considering more recent science to create the best estimates of greenhouse gas emissions from agriculture. We will use agricultural census data from 2011 for Abbotsford to estimate GHG emissions.
References
Agriculture and Agri-Food Climate Change Table. 2000. Reducing Greenhouse Gas Emissions from Canadian Agriculture – Options Report. Publication # 2028E
Biocap. 2006. The potential for agricultural greenhouse gas emission reductions in the temperate region of Canada through nutrient management planning. Soil Resource Group. OMAFRA, Ontario. A Biocap Research Integration Program Synthesis Paper.
FAO, 2003. World Agriculture: Towards 2015/2030. An FAO Perspective. FAO, Rome, 97 pp.
Gattinger, A., J. Jawtusch, A. Muller and J. Olesen. 2011. Mitigating Greenhouse Gases in Agriculture: A challenge and opportunity for agricultural policies. Dlakonisches Werk der EKD, Stuttgart, Germany.
Gerber, P.J., H. Steinfeld, B. Henderson, A. Mottet, C. Opio, J. Dijkman, A. Falcucci, and G. Tempio. 2013. Tackling climate change through livestock – A global assessment of emissions and mitigation opportunities. Food and Agriculture Organization of the United Nations (FAO), Rome.
Kebreab, E., K. Clark, C. Wagner-Riddle and J. France. 2006. Methane and nitrous oxide emissions from Canadian animal agriculture: A review. Can. J. Animal Science 86:135-158
Levelton Consultants. 2004. Analysis of Best Management Practices and Emission Inventory of Agricultural Sources in the Lower Fraser Valley (www.abbotsfordtoday.ca/wp-content/uploads/2010/05/draftreport_dec6_final.pdf
Mc Geogh, E.J., S.M. Little, H.H. Janzen, T.A. McAllister, S.M. McGinn and K.A. Beauchemin. 2012. J. Dairy Science 95: 5164-5175
Smith, P., D. Martino, Z. Cai, D. Gwary, H. Janzen, P. Kumar, B. McCarl, S. Ogle, F. O’Mara, C. Rice, B. Scholes, O. Sirotenko. 2007. Agriculture. In Climate Change 2007: Mitigation. Contribution of Working Group III to the Fourth Assessment Report of the Intergovernmental Panel on Climate Change [B. Metz, O.R. Davidson, P.R. Bosch, R. Dave, L.A. Meyer (eds)], Cambridge University Press, Cambridge, United Kingdom and New York, NY, USA.
US EPA 2006. Global Anthropogenic Non-CO2 Greenhouse Gas Emissions. 1990-2020. United States Environmental Protection Agency, EPA 430-R-06-003. Washington, DC.
An increasing amount of insecticides applied for controlling the spotted wing drosophila on ripening raspberries and blueberries may be having a detrimental effect on our bee population. There is an article in the Vancouver Sun today regarding potential concern over honey bees and the effect of insecticides (http://blogs.vancouversun.com/2014/06/26/some-bee-friendly-plants-treated-with-harmful-pesticides/). All of the insecticides used to control the spotted wing drosophila are labelled as harmful to bees. The insecticides are applied when the fruit is ripening.
The lists of insecticides allowed for use on the ripe blueberries is not encouraging. There are five allowed for use in British Columbia and 15 allowed for use just across the border in Washington State. This is a concern for growers in BC because their Washington competitors have more options which are also less costly.
All insecticides used for spotted wing drosophila control are reported harmful to bees (BC Ministry of Agriculture 2013, and Oregon State University 2013). Our neighbours to the south allow neonicotinoids insecticides which are topic of great debate and have been banned in Europe because of suggested harm to bees. Foliar application of these insecticides certainly can increase risk of harm to bees, especially during pollination.
Although there are many debates over the safety of our food with the use of pesticides, there is enough information to suggest potential harm. Thankfully, many of the insecticides target biochemical pathways specific to insects and which are not found in humans. We also realize that there are other implications that we can’t necessarily foresee. In a review of 104 scientific studies, Pezzoli and Cereda (2013) concluded that exposure to pesticides increases the risk of Parkinson’s disease. Samsel and Seneff (2013) suggest that the effect of glyphosate, a herbicide that was first labelled as organic, specific to plants, and completely harmless in soil, is as follows: “Negative impact on the body is insidious and manifests slowly over time as inflammation damages cellular systems throughout the body.”
There are 8200 ha of blueberries in the lower Fraser Valley (Statistics Canada 2011). With the increased concern of damage from the spotted wing drosophila, it translates into a lot of insecticide spraying when the berries are ripe. Have we all participated in a decision that any increased health risk is worth it because of the value of the blueberry to our economy? Can we with our creative minds, come up with a method of growing food that minimizes our potential health risks? What is an acceptable health risk?

Increasing amounts of insecticides are required to control the spotted wing drosophila on our soft fruits in the Fraser Valley.
I realize that all things need to be taken in perspective. Last summer, I observed that fast food restaurants in California are required to post sign stating that some chemicals known to cause harm may be present in foods or beverages sold here. I really hope that the time doesn’t come when our supermarkets have to post signs by our fruit and vegetables that state that these products may contain trace amounts of harmful chemicals, or that the production of these products may negatively impact the environment….
According to an article in Time Magazine entitled “The Plight of the Honey Bee” http://content.time.com/time/magazine/article/0,9171,2149141,00.html, we may not have to worry about growing blueberries in the future. The potential death of the honey bee, regardless of why it is dying, will mean the end of blueberries because the bees are no longer there to pollinate them….
Update September 5, 2014 – Ontario beekeepers sue Bayer and Magenta over neonicotinoid pesticides- http://www.cbc.ca/news/technology/canadian-beekeepers-sue-bayer-and-syngenta-over-neonicotinoid-pesticides-1.2754441
References
BC Ministry of Agriculture. 2013. Spotted Wing Drosophila (SWD) Management in BC Berry Crops. July 3, 2013. http://www.agf.gov.bc.ca/cropprot/swd_management.pdf
Oregon State University. 2013. Insecticides registered for use in OR and WA Blueberries for management of SWD, and considerations for their use. July 15, 2013. http://spottedwing.org/system/files/Blueberry%20SWD%20Pesticides%20for%20OR%20and%20WA%20July%202013.pdf
Pezzoli, G., and E. Cereda. 2013. Exposure to pesticides or solvents and risk of Parkinson disease. Neurology 80: 2035-2041.
Samsel, A., and S. Seneff. 2013. Glyphosate’s Suppression of Cytochrome P450 Enzymes and Amino Acid Biosynthesis by the Gut Microbiome: Pathways to Modern Diseases. Entropy 15: 1416-1463.
Last week I appreciated how agriculture and environment work well together in the state of Wisconsin. When the value of agriculture and the value of the environment are both appreciated, everyone wins, and can be proud of their communities.
I had the privilege of visiting three large dairies, all of whom are required to operate with a Nutrient Management Plan, a state requirement which includes regular submissions, review and visits by Department of Natural Resources staff. Nutrient management plans follow both nitrogen and phosphorus, both of which have potentially harmful impacts on surface and groundwater. Plans are mandatory for farms having more than 1000 animal units (699 cows), but local governments may also require nutrient management planning for smaller farms. The primary reason for nutrient management planning is to protect ground and surface water quality.
There was scenery and farms in Wisconsin that reminded me of my days reading Hoard’s Dairyman on our farm in the mid 70s.
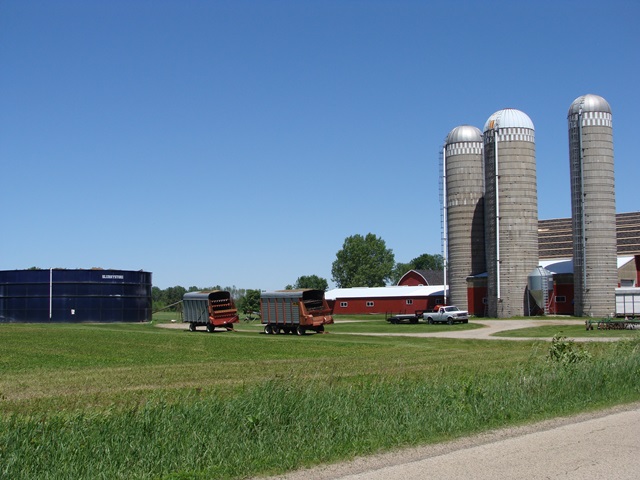
A Wisconsin dairy that I could almost recognize from 1975 issues of Hoard’s Dairyman!
Much has changed. Hoard’s Dairyman is printed in Spanish – as most of the staff taking care of the animals are Mexican. The vertical feed silos stand empty, and most manure is stored in earthen lagoons. There are a number of farms with anaerobic digesters, but the industry understands that anaerobic digesters don’t solve nutrient management challenges. They work well to reduce odor from manure, and may provide electricity for the farm. Contracts for green electricity are not as lucrative as they once were. An increasing number of farms that separate solids after digestion have realized that further drying or processing is necessary to reduce the risk of disease. I visited two dairies that have anaerobic digesters. Both dairies use the separated dairy solids for bedding the cattle, but only after processing through a triple pass natural gas dryer.
While there are promising technologies coming available to economically process manure into water and nutrients, we know that we are not there yet. Many organizations in the world have been trying to develop cost effective technology for many years. In Wisconsin, manure and digestate is applied to farm land surrounding the dairies. Pipes carrying manure for several miles from the large dairies is a common sight. There is enough cropland to sustainably utilize manure nutrients in Wisconsin, where most of the feed for the animals is locally produced.

Large dairies with 2000-4000 cows are now a common site in Wisconsin.
There is security for the farmers knowing that their nutrient management plans are being actively being reviewed. There is less concern with trying to reduce costs by over applying manure to a smaller landbase, or to concentrate the applications to the fields close to home. As a result, there is an obvious pride within the communities, and a willingness for learning.
What can we learn from this for our agriculture in British Columbia? Mandatory nutrient management planning will provide the following benefits:
1. reduced risk of surface and ground water quality pollution from excess manure application
2. a sustainable context in which to evaluate the benefits of anaerobic digestion, instead of simply hoping that it will solve nutrient excesses on the farm.
3. allows creativity to optimize the value of the manure nutrients for crop production.
4. reduces societal cost and risk associated with groundwater quality and with fish in surface waters
5. sets a level playing field for the agricultural community so that economic benefit for the farmers is not correlated with greater environmental impact.
6. increases the pride in our community and in our agriculture/environment interface.
On the eve of our son’s birthday, I was again reminded of the large experiment that we have allowed ourselves to be in (see previous posts). New research apparently demonstrates that our # 1 herbicide is actually bioaccumulating in our bodies (http://sustainablepulse.com/2014/04/06/worlds-number-1-herbicide-discovered-u-s-mothers-breast-milk/).
In this blog, I will discuss the role of agroecology in reducing the need for pesticides and protecting our groundwater.

There is increasing disease pressure in both raspberry and blueberry production over a vulnerable aquifer that supplies drinking water to our communities that is requiring new and stronger pesticides
Other professionals have made agricultural management suggestions regarding protection of our groundwater in the aquifer. Ageson (http://www.ag-innovation.usask.ca/policyconference/Research_Posters/2012Poster_PDF/LEARN06-Ageson.pdf) suggested that Abbotsford could pay farmers to plant benign crops such as pasture. Golder Associates (http://www.abbotsford.ca/Assets/Abbotsford/Dev+Services+-+Planning+and+Environment/environmental/Draft+Groundwater+Management+Strategy+-+November+2011.pdf) suggested financial incentives to implement groundwater related activities such as nutrient management and irrigation plans. In 2006, I suggested that our community could provide incentives for composting to divert excess manure and nutrients to protect our ground and surface waters.
Implementing agroecological principles may provide a sustainable solution to managing our soils above vulnerable aquifers. The two main tenants of agroecology are adding organic matter to our soils to increase soil health, and implementing biodiversity to increase natural pest resistance.
Agroecological systems are based on the following principles:
1. reduce the use of environmentally damaging, manufactured, costly or scarce inputs, increase the use of natural, local inputs, and enhance biological interactions to promote ecological processes and services. For example, to replace the use of synthetic nitrogen fertilizers; or the use of in-field biodiversity and biological controls to manage pests, diseasesand weeds and to reduce, or where possible eliminate, the use of chemical pesticides.
2. Minimize the quantites of toxic or polluting substances released to the environment.
3. Manage nutrients more efficiently by recycling biomass and regularly adding crop residues, animal manures and composts, to enhance organic matter accumulation in soils and to balance and optimize the nutrient cycle
4. Increase the soil cover, for example through cover crops and green manures and reduce the amount of tillage, if possible to zero, to minimize soil erosion and the loss of water/moisture and nutrients. These practices, together with water harvesting, aim to use water more efficiently.
5. Promote soil biological activity to maintain and enhance soil fertility.
6. Maintain high species and genetic diversity in time and space and a complex agro-ecosystem structure, in order to provide a range of important ecological services and increase the agro-ecosystem’s resistance and resilience to changes. ftp://ftp.fao.org/SD/SDA/SDAR/sard/SARD-agroecology%20-%20english.pdf
Many international organizations are embracing agroecology as the most likely strategy to meet future world food requirements. In 2010, the United Nations General Assembly suggested that agriculture “should be fundamentally redirected towards modes of production that are more environmentally sustainable and socially just”, and defined agroecology as follows:
“Agroecology is both a science and a set of practices. It was created by the convergence of two scientific disciplines: agronomy and ecology. As a science, agroecology is the “application of ecological science to the study, design and management of sustainable agroecosystems.” As a set of agricultural practices, agroecology seeks ways to enhance agricultural systems by mimicking natural processes, thus creating beneficial biological interactions and synergies among the components of the agroecosystem. It provides the most favourable soil conditions for plant growth, particularly by managing organic matter and by raising soil biotic activity. The core principles of agroecology include recycling nutrients and energy on the farm, rather than introducing external inputs; integrating crops and livestock; diversifying species and genetic resources in agroecosystems over time and space; and focusing on interactions and productivity across the agricultural system, rather than focusing on individual species. Agroecology is highly knowledge-intensive, based on techniques that are not delivered top-down but developed on the basis of farmers’ knowledge and experimentation.”
(http://www2.ohchr.org/english/issues/food/docs/A-HRC-16-49.pdf)
We need to understand what agroecology is. Its more than simply organic farming. The quotations further in this blog come from Miguel Altieri and Clara Nicholls (http://www.agroeco.org/doc/agroecology-engl-PNUMA.pdf).
The need for pesticides and chemicals are reduced when we take care of our soil:
“The ability of a crop plant to resist or tolerate pests is tied to optimal physical, chemical and biological properties of soils. Adequate moisture, good soil tilth, moderate pH, right amounts of organic matter and nutrients, and a diverse and active community of soil organisms all contribute to plant health… There are positive interactions between soils and pests that once identified can provide guidelines for optimizing total agroecosystem function.”
The need for pesticides and chemicals are reduced when we increase our biological diversity:
“It is widely believed that agroecosystem diversity is associated with long term stability of included populations, presumably because a variety of parasites, predators, and competitors is always available to suppress population growth of potential pest species. Dispersal of food plants among other nonhost plants may make migration, host, and mate location, and consequently exponential growth of phytophages or pathogens, more difficult. Plant diversification of agroecosystems can result in increased environmental opportunities for natural enemies and, consequently, improved biological pest control.
Research has shown that by adding plant diversity to existing annual monocultures, it is possible to exert changes in habitat diversity which in turn favor natural enemy abundance and effectiveness. This information can be used to design mixed cropping systems that enhance predator and parasitoid diversity and abundance, thus resulting in lower pest loads than in monocultures.
The enemies hypothesis attributes lower pest abundance in intercropped or more diverse systems to a higher density of predators and parasitoids“
Agroecology is about reducing the need for pesticides through building up natural “immunity” in the soil and the plants, but does not suggest that pesticides should be completely eliminated in all situations:
“Large scale commercial agriculture involving crops that have a major complex of pests are initially likely to require the integration of chemical and cultural pest control methods along with the use of natural enemies. In such cases the conversion to a production system totally dependent on biological control will require a stepwise process of agroecological conversion including the efficient use of pesticides (IPM), input substitution (the replacement of insecticides for botanical or microbial insecticides) ending with the re-design of a diversified farming system which provides the environmental conditions for natural enemies, thus allowing the agroecosystem to sponsor its own natural protection against pests.
Emphasis is on preventing pest problems by enhancing the «immunity» of the agroecosystem and on integrating pest management activities with other farming practices that maintain soil productivity and crop health, while ensuring food security and economic viability.”
Agroecology recognizes that there is increased disease pressure as we intensify our agricultural production. Increased disease pressure results from the following:
” 1. decreased landscape diversity
2. decreased on-farm plant diversity
3. pesticide induced insect outbreaks
4. fertilizer induced insect outbreaks
5. weather induced insect pest outbreaks
6. changes induced by plant breeding
7. transgenic crops and increased risks of insect outbreaks
Agroecology encourages practices that enhance the greatest abundance and diversity of above and below-ground organisms. While these epigeal and aerial components have usually been considered in isolation from one another, they are dependent upon each other. Producers provide the organic carbon sources that drive the decomposer activity, which is in turn responsible for mineralizing nutrients required for maintaining growth of the producers. On the other hand mutualists, herbivores, pathogens, predators and parasites affect producer-decomposer interactions both by directing changes in the flow of energy and resources or by imposing selective forces.”
Agroecology is not a simple formula. It involves research and experimentation to discover management techniques and companion plantings that provide high yields with less pesticide inputs.
“In agroecology, a need for more categorical research on the use of crop diversification, recommending that more attention should be devoted to:
1. defining ways to suppress pest through diversity without significant yield reductions;
2. determining how mixed cropping systems impact the population dynamics and searching behaviors of natural enemies;
3. discovering methods to make mixed plantings more economically feasible and compatible with conventional farm operations;
4. determining how mixed cropping systems can be effectively combined with other pest control tactics.”
It would be great to be able to use our experiences, our creativity and our knowlege to model healthy ecosystem management while producing safe and nutritious foods, as well as providing incomes to our farming community.
Agroecology (primarily soil management and biological diversity for social, economic and environmental sustainability) connects us with the rest of the world, connects us with a sustainable future for our children, and connects us with ourselves.
1. Agro-ecology connects us with the rest of the world
Most of the world is already practicing some form of agroecology.
Fifty percent of the food consumed domestically in the world comes from 350 million small farms cultivated by 1.5 billion smallholders, mostly located in the developing world, and occupying only 20-30% of the arable land. Many traditional farming communities and indigenous peoples have over generations developed agricultural systems that can be considered agro-ecologically-based. Such traditional farmers domesticated 5,000 crop species and 1.9 million plant varieties, mostly grown without agrochemicals (ETC, 2009, referenced in http://www.e-alliance.ch/typo3conf/ext/naw_securedl/secure.php?u=0&file=fileadmin/user_upload/docs/All_Food/2012/Rio___20/Members/Nourishing-the-World-Sustainably-Scaling_up_acro-ecology.pdf&t=1346247361&hash=10524a83c979f8fd558db309befc743c).
As a way to improve the sustainability of food systems, agroecology is now being advocated by wide range of experts within the scientific community, and by international agencies and organizations such as the United Nations Food and Agriculture Organization (FAO).
Traditional systems and agro-ecology are generally based on polycultures, which produce yields per unit land area that are in the range of 20 to 60 percent higher than those produced from monocultures with the same management level.ftp://ftp.fao.org/SD/SDA/SDAR/sard/SARD-agroecology%20-%20english.pdf
The FAO has even developed a global agroecological zoning system for determining agricultural production potentials and carrying capacity of the world’s land area. http://www.fao.org/nr/land/databasesinformation-systems/aez-agro-ecological-zoning-system/en/
“The cases reported above show that in Africa, Asia and Latin America there are many NGO and farmer led initiatives promoting agro-ecological production that have demonstrated a positive impact on the livelihoods of millions of people living in small farming communities in various countries. Agro-ecology has consistently proven capable of sustainably increasing productivity and has far greater potential for fighting hunger, particularly during economic and climatically uncertain times that in many areas are becoming the norm.” http://www.e-alliance.ch/typo3conf/ext/naw_securedl/secure.php?u=0&file=fileadmin/user_upload/docs/All_Food/2012/Rio___20/Members/Nourishing-the-World-Sustainably-Scaling_up_acro-ecology.pdf&t=1346420896&hash=97ed3dd6bbf7af2175c0c6d0557fadae
2. Agroecology connects us with a sustainable future for our children
Agroecology is accepted as being able to meet future food requirements without further destruction of our environment and our social structure.
The United Nations prepared a report entitled “Agro-ecology and the Right to Food” in 2010. This report suggests that agroecology can double food production within 10 years while mitigating climate change, protecting and enhancing our environment, and alleviating rural poverty. This report included an extensive literature review. http://www.srfood.org/images/stories/pdf/officialreports/20110308_a-hrc-16-49_agroecology_en.pdf
The International Assessment of Agricultural Knowledge, Science and Technology for Development (IAASTD) prepared a report that was endorsed by 59 countries in 2008. Its stated mission was to assess the situation of agriculture worldwide, draw conclusions, and formulate recommendations for the future. Its main assertion is that “business as usual is not an option.” Its recommendations are designed to implement sustainable farming practices such as agroecology and organic agriculture worldwide.
“Agroecological, eco-efficient, and organic agriculture, which are among the several good agricultural practices under the label “sustainable agriculture,” cannot only nourish a world population of some 9 to 10 billion people, but are the only approaches that will be able to do it in the face of climate change, natural resource scarcity, and growing demand challenges. Unless we have the resilience provided by these systems at the basis of our multi-functional production systems, we will face major problems.
So the solutions are at hand, there is evidence from the field for now over three decades that sustainable agriculture cannot only nourish the world, but can do so for the long haul.”
quotation by Hans Herren, Ph.D. co-chair of IAASTD, an initiative sponsored by the World Bank and United Nations in partnership with the World Health Organization that assessed global agriculture and recommended agroecological solutions to world hunger. http://www.non-gmoreport.com/articles/december2011/scientistsaysagroecologyfeedsworld.php
The “Scaling-Up Agro-Ecological Food Production” sponsored by the Ecumenical Advocacy Alliance brought together science and theology to reflect on how sustainable, smallholder-based, agro-ecological methods of food production can be scaled-up sufficiently to feed the world. This discussion attempted to contribute to the outcome of UNCSD/Rio+20 by:
“(1) sharing information on the different farming systems that are encompassed in agro-ecological food production and the demonstrable benefits of these methods;
(2) stimulating discussions about how agro-ecological food production could reduce pollution while rebuilding the fertility of the soil and safeguarding the biodiversity of the planet;
(3) profiling the extent to which these methods can reduce food waste and post harvest losses from the producer to the consumer and ensure the most efficient use of natural resources;
(4) showcasing the extent to which agro-ecological food production can be an effective climate change adaption and mitigation strategy;
(5) demonstrating how these food production methods could assist in reducing global poverty and ensuring the right to food and nutritional security by supporting livelihoods;
(6) advocating for the support of the small holder food producers, whose production capacity is the foundation of food security in much of the developing world, but whose interests are often ignored in relevant policy formulation and/or implementation; and
(7) highlighting what is required for scaling up the use of these methods and encourage policy makers and public commitment to investing in agro-ecological food production with the necessary finance, research and capacity building.” http://www.e-alliance.ch/en/s/food/rio-plus-20/scaling-up-agro-ecology/
3. Agroecology connects us with ourselves
Agroecology is not simply organic farming, it connects agriculture with the environment, our economy and our social well being. Agroecology connects us with the whole people that we were created to be.
The first people who took care of this land before we came, understood that stewardship is about caring for the land.
“We are stewards of the land and we need to look after it. The Creator won’t make more. We need to assume our responsibilities. This is the basis of our culture and traditions. We need to leave something for our children.” Seabird Island Chief Clem Seymour
For many of us who came to this land afterward, our Judeo-Christian heritage advocated caring for the creation and all of the people in it is simply part of our God given mandate. Rev. Fuchs of the Ecumenical Advocacy Alliance wrote a great theological reflection on agroecological farming:
“God made the universe and formed humans in God’s image to be God’s flagpole on earth and to act according to the divine preservative purpose. God’s caressing breath into humans’ nostrils shows that God’s priority is relationship.
God loved the world so much that God sent Jesus to serve and suffer for reconciliation and abundant life, in order that we may learn to love and serve each other.
When we experience that God speaks to us with love and that he suffers when his creatures suffer, we feel challenged and are set free to be God’s partners in the project of God’s kingdom of social and environmental justice.
For agro-ecology the social and environmental aspects are related. We take care of the garden because of ourselves, because of the consistency with our humanness, and because of our privileged condition as beloved interlocutors with God. Abundant life is always life shared with others, empowering the impoverished and strengthening the weak, as Jesus did and promised for all.”
Abbotsford is the home for many faith based international organizations that work to help others around the world. Many church based groups and non government organizations (NGOs) have already been connecting with others throughout the world on promoting agroecological principles.
“Since the early 1980s, hundreds of agro-ecologically-based projects have been promoted by NGOs and church-based groups throughout the developing world, which incorporate elements of both traditional knowledge and modern agricultural science. A variety of projects exist featuring resource-conserving yet highly productive systems, such as polycultures, agroforestry, soil conservation, water harvesting, biological pest control and the integration of crops and livestock, etc. Approaches to training farmers on agro-ecological methods and disseminating best practices encompass a great variety: field days, on-farm demonstrations, training of trainers, farmers cross-visits, etc. Much of the spread of Conservation Agriculture in southern Africa reaching >50,000 farmers has been attained via one or more these methods.” http://www.e-alliance.ch/typo3conf/ext/naw_securedl/secure.php?u=0&file=fileadmin/user_upload/docs/All_Food/2012/Rio___20/Members/Nourishing-the-World-Sustainably-Scaling_up_acro-ecology.pdf&t=1346420896&hash=97ed3dd6bbf7af2175c0c6d0557fadae
Let’s reflect on the following quotation prepared by a multistakeholder group facilitated by the FAO. Does this not apply to our agricultural activity right here in Abbotsford as well?
“Agriculture and rural development are sustainable when they are ecologically sound, economically viable, socially just, culturally appropriate, humane and based on a scientific approach. Rural development policy must aim to meet the nutritional and other human needs of present and future generations; and maintain, and where possible, enhance the productive and regenerative capacity of the natural resource base, It must also provide for the durable employment of those generations, reduce their vulnerability and strengthen their self-reliance.” ftp://ftp.fao.org/SD/SDA/SDAR/sard/SARD-agroecology%20-%20english.pdf
We are all part of a health/environment/economics experiment. Does the use of geneticially modified foods and pesticides maintain or improve our health, increase our food supply and decrease our costs as consumers?
Last year, California voters decided that labelling of genetically modified foods was not important. What is perhaps most interesting about this is that the opponents to GMO labelling (industry and agriculture) spent more than $ 45 million opposing labelling (http://www.cnn.com/2012/11/08/health/california-gm-foods/index.html). An article suggested that “a collective discussion on GMO labelling is not just about labelling, but more importantly about food democracy: giving consumers a chance to make well-informed choices.” (http://www.theprovince.com/life/time+intelligent+discussion+about+GMOs/7531531/story.html#axzz2C6pYZhaN). I agree with this conclusion, we in Canada should be invited to make well informed choices. After all, more than 50 countries in the world require genetically modified foods to be labelled!
The argument against labelling was that California households would have had to pay $ 400 more for food per year if genetically modified foods required labelling. Do we really know this? Some will suggest that we will never be able to feed the world without genetically modified plants, or without pesticides. Is this true? On the other hand, there are many who believe that we do not require genetically modified foods to feed our world. There are also many who believe that we can reduce our pesticide use as well.
There is a recent documentary called Bitter Seeds demonstrating the economic experimentation associated with the use of geneticially modified seeds in India. This documentary shows how Indian farmers were to gain more profits and live a better life if they switched to genetically modifed cotton.
This movie documented that yields were not as high as promised, and farmers required more fertilizers and pesticides. Net revenue actually decreased to the point where the farmers were losing their lands to the money lenders, and that one farmer in India commits suicide every 30 minutes from the shame of losing their land. Interestingly, most of the suicides are by drinking pesticides. In this area of India, the geneticially modified seeds experiment did not work in the farmer’s favor!
In a following post, I will discuss the concept of agroecology, which is becoming more recognized as being able to feed our world for future generations in a manner that engages and benefits local farmers, and reduces dependency on GMOs and pesticides.
The agricultural experiment is about our health. Does the use of genetically modified foods, and the increasing use of pesticides that seem to go along with it, increase or decrease our health? There is the suggestion that “to suggest genetically modified ingredients pose a threat to consumers is scientifically precipitous. Most studies that draw this conclusion are either methodologically unsound or contain flawed data sets. Thus far, science has demonstrated that products containing GMOs are perfectly safe for human consumption. Since they have only been on the market since 1994, however, more research is obviously warranted.” (http://www.theprovince.com/life/time+intelligent+discussion+about+GMOs/7531531/story.html#axzz2C6pYZhaN). We have an acknowledgement that more research is obviously warranted – that we are indeed part of an experiment.
I agree with David Suzuki on this point. He stated: “Because we aren’t certain about the effects of GMOs, we must consider one of the guiding principles in science, the precautionary principle. Under this principle, if a policy or action could harm human health or the environment, we must not proceed until we know for sure what the impact will be. And it is up to those proposing the action or policy to prove that it is not harmful.” (http://www.davidsuzuki.org/blogs/science-matters/2009/09/more-science-needed-on-effects-of-genetically-modifying-food-crops/).
I am not against genetically modified foods in principle. However, as a scientist, I understand that the insertion of gene sequences is very different and has a much greater risk level than producing hybrid seeds, which is also suggested to be genetic modification. I am also not against the use of pesticides. As with genetically modified foods, science is showing that there may be long term health risks.
The fact that we have to spray increasing amounts of pesticides including insecticides on our food is concerning to me. We know that insecticides are more potentially dangerous than herbicides. We know that there is a greater risk of insecticide risks if the ripe fruit needs to be sprayed during harvest, as we are now seeing with our blueberry production in the Fraser Valley.
We are part of a large agricultural experiment with both pesticides and genetically modified foods. Are we okay with this? Do we understand potential impacts of producing our food on the health of the planet and the health of our children? We need to keep encouraging open and honest dialogue between our food suppliers and our food consumers. Who drives the process?
We should all be involved in this discussion. The discussion is already beginning in a couple of different ways, although it is indirect. One way is that our consumers are looking at urban agriculture as a way to be involved with local healthy food production. Another way is the increasing involvement in runs/bike rides etc for cancer or other illnesses, which is about personal health. Eating healthy food is about personal health as well. The momentum is building!
We are part of one large experiment that we all have indirectly consented to! We do have a voice!
Post note: I was in Pakistan on August 12, 2014, only to find an interesting article in the Pakistan International News that was placed at my hotel door. An article entitled “A Poisonous Lifestyle” written by Najma Sadeque mentioned the following:
“For the past 40 to 50 years, we have been easting poison…not enough to kill us in one go, but building up enough to cause a whole range of diseases, some incurable like cancer….today, most of our problems, including that of poisoning ourselves unknowingly, are due to the blind faith most of us are taught to have in science….Science was never a fixed library of information to be readily accessed. Nor has everything in existence been discovered or fully understood….”
