
Although some may consider GHG emissions from animal agriculture, particularly nitrous oxide emission, a “laughing” matter, our global concern regarding manure management and antimicrobial resistance is not. The future of our planet in relation to antimicrobial resistance is quite literally in the dirt. We cannot undermine the power and adaptability of our microbes. This also includes the vast untapped resource of microbes that we have in our soil that are able to help us manage antimicrobial resistance. In 2015, the International Year of Soil, we can read about the importance of our soil for the health of our planet. Our soil is also critical in managing antimicrobial resistance.
“Soil is part of the solution to some of the greatest dilemmas of our time. It plays a critical role in mitigating the effects of climate change, increasing farm productivity and food security, and may hold the answers to eradicating antibiotic resistance. If we truly want to achieve the Sustainable Development Goals we’ve set for ourselves, we can’t afford to not focus on soil health” (Kainth, 2015)
What is the concern about antimicrobial resistance, what does manure have to do with antimicrobial resistance, and why is this important in Abbotsford, or in any other community for that matter? This is the first of a series that explains some of these questions, and addresses some potential manure management strategies to reduce the impact of antimicrobial resistance. Managing manure to reduce GHG emissions, particularly nitrous oxide emissions as outlined in previous posts, (Greenhouse Gas Emissions from Animal Agriculture in Abbotsford) is one excellent step in managing the risk of antimicrobial resistance from animal manures.
Antimicrobial resistance is one of our greatest health concerns
The Auditor General of Canada outlined the concern with antimicrobial resistance in a recent report (Office of the Auditor General 2015). This report provides an excellent introduction to the development of this concern from the time that antimicrobials were first discovered and developed, to the health impacts of antimicrobial resistance in the US and Europe. They stated:
“Antimicrobial resistance is a global public health challenge. It affects human and animal health, agriculture, the environment, and the economy. Organisms resistant to antimicrobial drugs can emerge in humans, animals, or the environment. These organisms can be transmitted from animals to humans through food or direct contact.”
A review in the UK acknowledges the 50,000 deaths per year in the US and Europe currently attributable to antibiotic resistance, and estimates that this number will increase to 10 million per year by 2050, with a cost of $ 100 trillion USD (O’Neill 2014). This report concludes that the extent of this crisis can be averted if we all act together soon.
In Canada, Grant et al. (2014) acknowledged the importance of working together as a global community and that past efforts in Canada to collect and report antimicrobial resistance in Canadian communities, as well as monitoring antimicrobial use in various human and animal settings has been lacking. They stated that:
“the protection of public health from consequences of antimicrobial resistance in microorganisms is a shared responsibility including federal leadership for a strong national, public health based coordination of surveillance, with engagement and collaboration of provincial and territorial health agencies, professional associations, animal health, and food animal-industry stakeholders.”
In an excellent review of the origins and evolution of antibiotic resistance, Davies and Davies (2010) reported that:
“Not withstanding all good intentions to control antibiotic usage (but limited action), there is little doubt that the situation with respect to antibiotic resistance is grim. Resistance mechanisms are pandemic and create an enormous clinical and financial burden on health care systems worldwide. There are no simple solutions to the problem. Decisive actions that require significant commitment and enforcement are never popular, even if lives can be saved.”
“Fortunately, not all bacterial pathogens are resistant all of the time, and many respond to empirical treatment with antimicrobial agents administered in the community. Success is perhaps due to luck rather than good judgement.”
Antimicrobial use in agriculture is a contributor
The World Health Organization made recommendations on the use of antimicrobials in agriculture to protect human health in 2000. (WHO 2000). The contribution of animal agriculture to antimicrobial resistance in humans has been reported in Canada almost 20 years ago (Khachatourians 1998). This review provides an excellent explanation of some of mechanisms of antibiotic resistance. The review also noted that the impact of antibiotics used in animals have impacted human health already in 1963. Its interesting to note the public concern regarding this issue already then.
“Over the recent past the public has become increasingly alarmed by new scientific data that have made their way into the popular media about the connection between the overuse of antibiotics (or, more accurately, antimicrobial drugs) in both medicine and the agriculture–agrifood industry and the emergence and spread of antibiotic-resistant bacteria.”
A more recent review further explains the risks associated with antibiotic use in agriculture (You and Silbergeld 2014) Another recent review of the impact of antibiotic use in agriculture addresses attempts by some farm organizations to downplay the potential impact of antimicrobial use:
“Although resistance in human infections is mainly caused by human antibiotic use, for a range of bacteria, farm animal use contributes significantly, and for some infections, is the main source of resistance. This fact has been established by decades of research and is acknowledged by organizations like the WHO and the European Food Safety Authority” (Alliance to Save Antibiotics 2014).
The use of antibiotics in agriculture worldwide is expected to increase by up to 67% by 2030 (Van Boeckel et al. 2015), so the issue is not going to go away too quickly! In the US, the use of medically important antimicrobials increased 16% from 2009-2012 (FDA 2014), where an estimated 68% of medically important antimicrobials were used for food producing animals. In Canada, we don’t even know how much we are using! Prescott (2014) reported that Canada is not able to access information on the import, sale and use of antimicrobials not evaluated and registered by Health Canada. Prescott (2014) assigned Canada an “F” on this recommendation made many years earlier, where an “F” indicates that “Canadian practice is inadequate, displays an unsatisfactory understanding of the stewardship issues involved, and fails to address in any significant way international standards or Canadian recommendations.”
Antimicrobial Resistance in our British Columbia communities
There is a part of all of us that likes to think that the concerns with antimicrobial resistance may be out there somewhere, but not in our communities, or not on our farm. Unfortunately, this is not true. Antimicrobial resistant organisms or genes have been measured in our manure, our waterways, our vegetables and our meat.
The Government of Canada (2013) provides surveillance information on specific antibiotic resistance in humans, on retail meats, in the abattoir, and on farms. Some notable observations included Ciprofloxacin resistance in Campylobacter measured in British Columbia retail chicken increased from 8% in 2012 to 26% in 2013. Resistance to ceftiofur by E.coli in the chicken was 28%.
Antibiotic resistant coliform bacteria were found on vegetables at British Columbia farmers markets (Wood 2013). Wood et al. (2015) reported that 97% of the E.coli possessed resistance at least one or more of the antimicrobials tested for. During vegetable production on the farm, the coliform bacteria count was dramatically higher on vegetables irrigated with ditch water than on vegetables irrigated with city water (Wood 2013). Manure or compost used on the farm was also a proven source of coliform bacteria. The recommendation in this thesis was to utilize only compost from proven and trusted sources.
Poultry litter in BC was reported to be a source of antimicrobial residues and represents a reservoir
of multiple antibiotic-resistant E. coli (Furtula et al. 2010). They reported that bacitracin, chlortetracycline, monensin, narasin, nicarbazin, penicillin, salinomycin, and virginiamycin were commonly used in poultry production in British Columbia. They observed that antibiotics in the litter reflected the antibiotics in the feed on the nine commercial farms. They measured resistance to amoxicillin, spectinomycin, streptomycin, and sulfonamides in E. coli isolated from litter.
In our Sumas River watershed, Keen (2009) consistently measured tetracycline resistant genes in the water, and observed that they were higher in the fall than during the summer. It is interesting to note that tetracycline resistant genes were also present in the control stream (no agricultural activity), however, no increases in tetracycline resistant genes were measured during the winter. The conclusion was:
“A direct causal relationship between agricultural sources and the concentration of contaminants measured in stream water samples cannot be verified based on the data provided herein. It is, however, likely that such an interconnection exists.”
Summary
We have antibiotic resistant microbes in our animals, in our soils, in our manure and in our water. We have to manage our resources carefully to limit the health risks in our communities. The soil organic matter plays an important role as a reservoir of antimicrobial genes, but also a huge resource of microbial biomass that also helps to purify our soil. It is possible that our soil organic matter plays an important role in buffering the potential risks of antimicrobial risks in the environment, and is important in our future response to this concern. We will pursue this more in a following post.
In all fairness to agriculture, I am keenly aware that in our community, animals and animal manure is not the only threat to the spread of antimicrobial resistance in our environment. It is my hope that we all, including our key decision makers, can move from what appears to be a helpless disregard to an action plan that protects the short term and long term health of our community.
Our local communities could provide an excellent model for sustainable management of manure and other organic wastes that provide leadership and hope in a world that so desperately needs it. We have an urban – rural interface that provides a strong connection and awareness, we have an urban and rural population that is interested in local healthy sustainable food production, and we have the resources to make it happen.
Let’s dare to “make decisive actions that may require significant commitment and enforcement”, as suggested by Davies and Davies (2010), because “lives can be saved”.
References
Alliance to Save Our Antibiotics. 2014. Antimicrobial resistance – why the irresponsible use of antibiotics in agriculture must stop. An Alliance between the Soil Association, Compassion in World Farming, and Sustain.
Davies, J. and D. Davies. 2010. Origins and Evolution of Antibiotic Resistance. Microbiology and Molecular Biology Reviews, Sept 2010 pp 417-433.
Food and Drug Administration. 2014. 2012 Summary Report on Antimicrobials Sold or Distributed for Use in Food-Producing Animals. FDA Department of Health and Human Services September 2014.
Furtula, V., E.G. Farrell, F. Diarrassouba, H. Rempel, J. Pritchard and M.S. Diarra. 2010. Veterinary pharmaceuticals and antibiotic resistance of Escherichia coli isolates in poultry litter from commercial farms and controlled feeding trials. Poultry Science 89: 180-188.
Government of Canada. 2013. Canadian Integrated Program for Antimicrobial Resistance Surveillance (CIPARS) Annual Report. Chapter 2. Antimicrobial Resistance. Public Health Agency of Canada, Guelph, Ontario.
Grant, J. Saxinger, L and Patrick, D. 2014. Surveillance of antimicrobial resistance and antimicrobial utilization in Canada. Winnipeg. Manitoba: National Collaborating Centre for Infectious Diseases.
Kainth, G.S. 2015. Healthy soil for healthy life – OpEd. 2015. Eurasia Review News and Analysis June 18, 2015.
Keen. P.L. 2009. Seasonal dynamics of tetracycline resistant genes and antibiotics in a British Columbia agricultural watershed. Ph.D. Thesis, University of British Columbia.
Khachatourians, G.G. 1998. Agricultural use of antibiotics and the evolution and transfer of antibiotic-resistant bacteria. Canadian Medical Association Journal 159:1129-36
Office of the Auditor General of Canada. 2015. Report 1. Antimicrobial resistance. Spring 2015. Minister of Public Works and Government Services. http://www.oag-bvg.gc.ca/internet/docs/parl_oag_201504_01_e.pdf
O’Neill, J. 2014. Antimicrobial resistance: Tackling a crisis for the health and wealth of nations. A review on antimicrobial resistance. UK Prime Ministers Office
Prescott, J.F. 2014. Stewardship of antimicrobial drugs in animals in Canada: How are we doing? Canadian Veterinary Journal 55: 273-276.
Van Boeckel, T.P. C. Brower, M. Gilbert, B.T. Grenfell, S.A. Levin, T.P. Robinson, A. Teillant, and R. Laxminarayan. 2014. Global trends in antimicrobial use in farm animals. www.pnas.org/cgi/doi/10.1073/pnas.1503141112
Wood, J.L. 2013. Examination of Microbiological Quality of In-field Leafy Vegetables and Identification of On-farm Generic Escherichia coli Transmission Dynamics. MSc Thesis, University of British Columbia.
Wood, J.L., J.C. Chen, E. Friesen, P. Delaquis and K.J. Allen. 2015. Microbiological survey of locally grown lettuce sold at farmers’ markets in Vancouver, British Columbia. Journal of Food Protection 78: 203-208.
World Health Organization (WHO). 2000. WHO Global Principles for the Containment of Antimicrobial Resistance in Animals Intended for Food. Report of a WHO Consultation with the participation of the Food and Agriculture Organization of the United Nations and the Office International des Epizooties. Geneva, Switzerland June 2000.
You, Y. and E.K. Silbergeld. 2014. Learning from agriculture: understanding low dose antimicrobials as drivers of resistome expansion. Frontiers in Microbiology June 2014, Volume 5, Article 284.
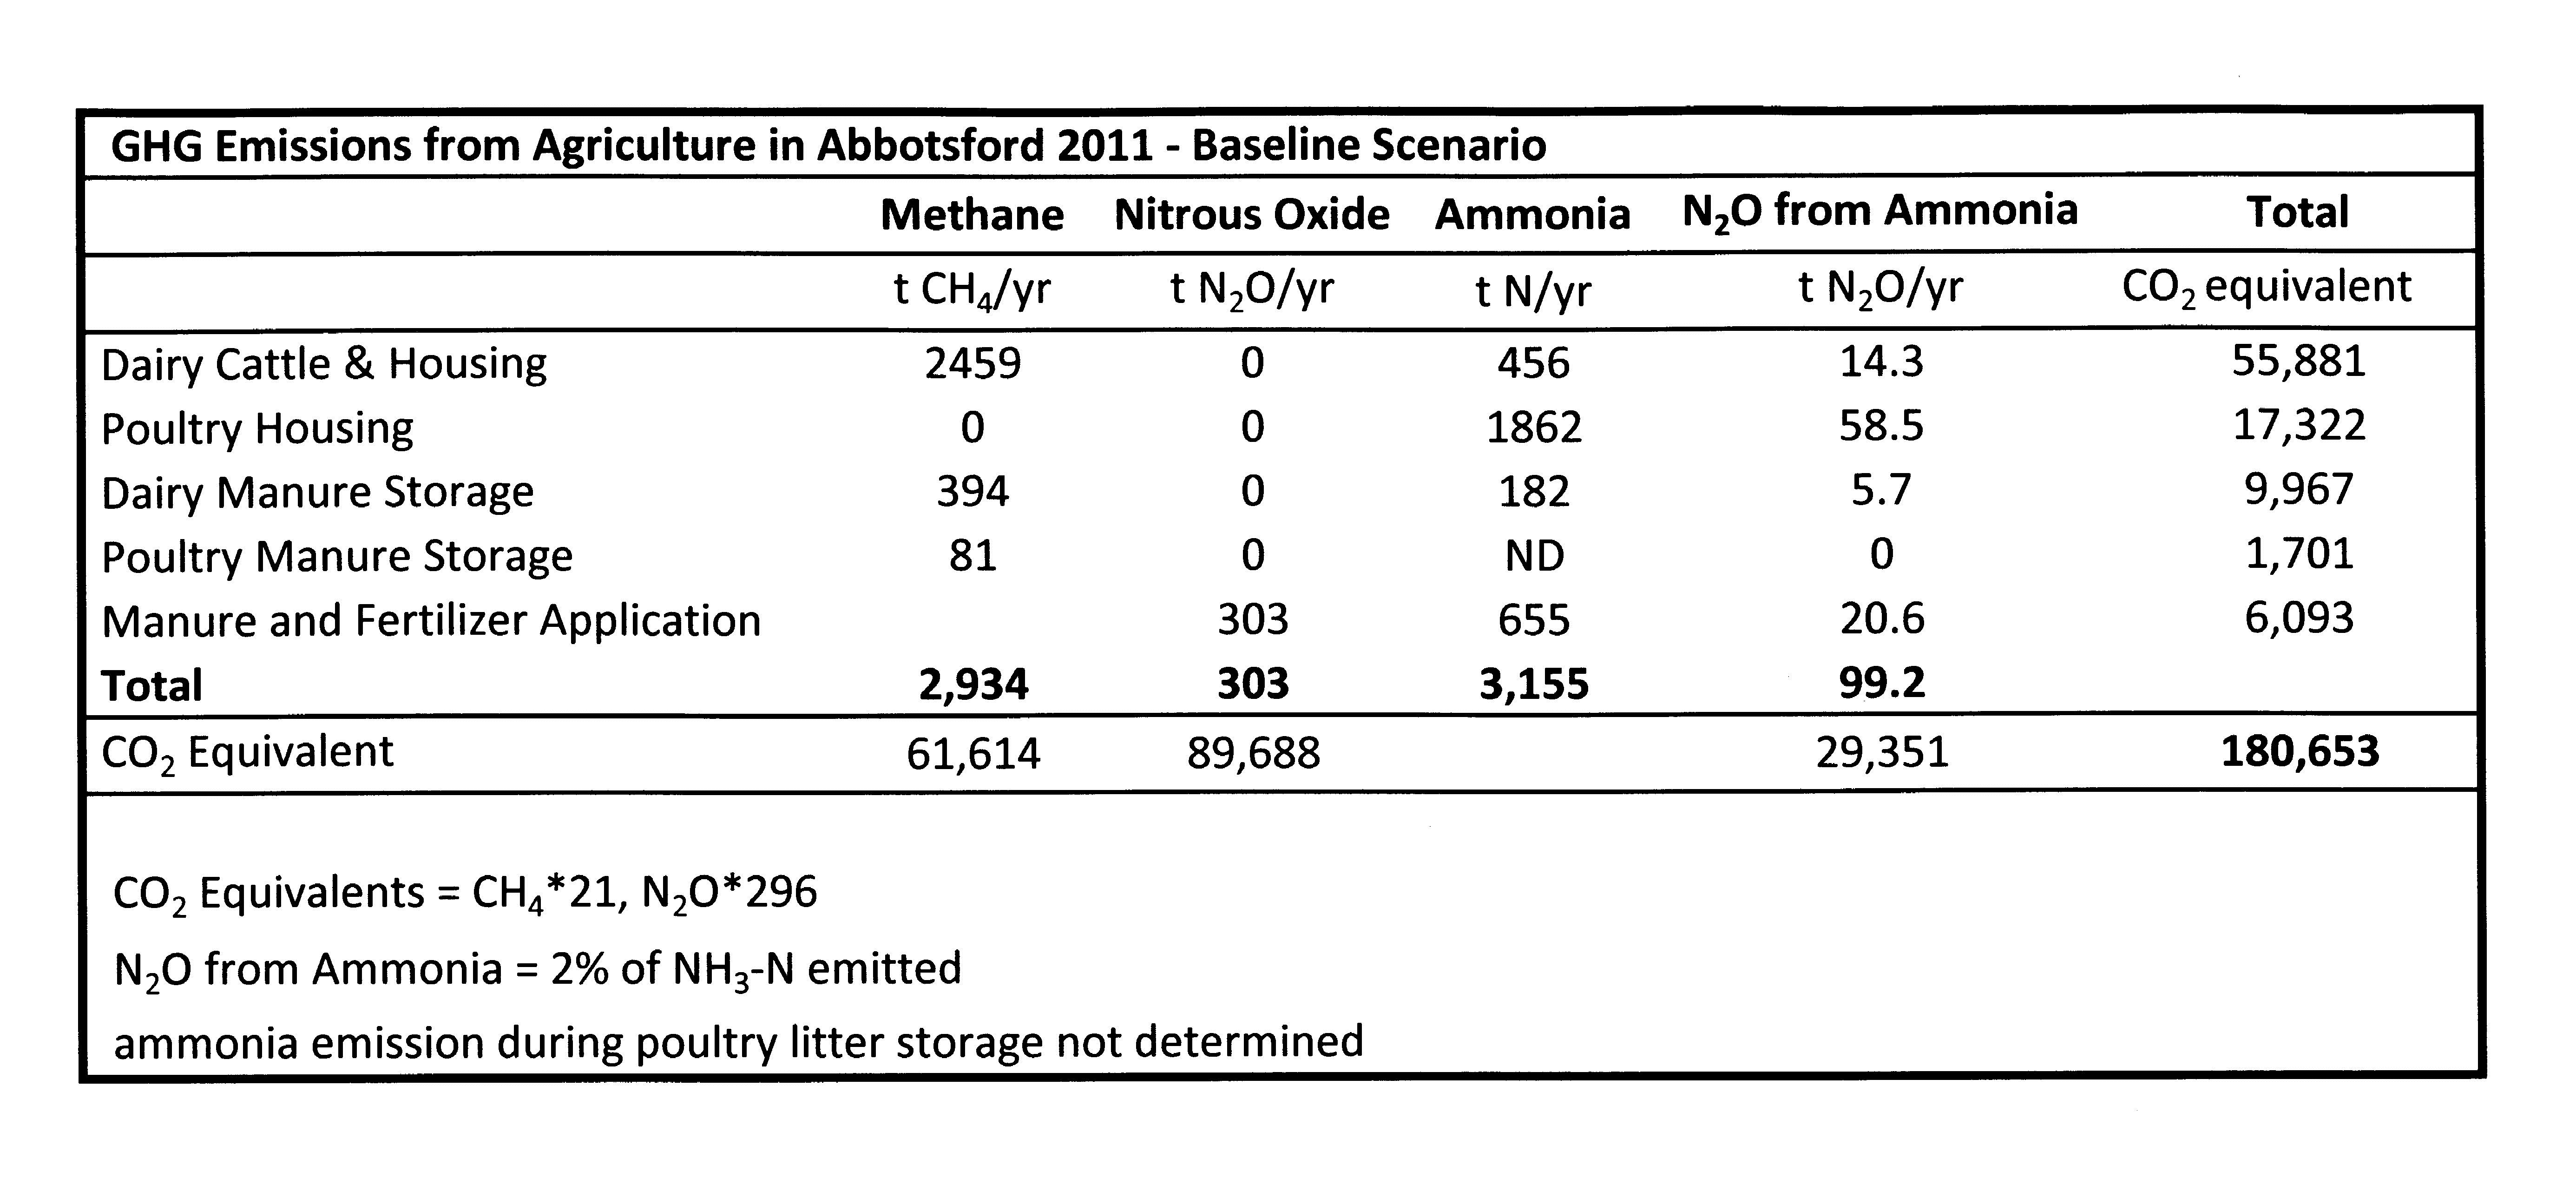
The total greenhouse gas emissions from agriculture in Abbotsford is estimated at 180,653 tonnes CO2 equivalent per year emitted from animal agriculture. Two thirds of that is nitrous oxide and one third is methane. About 5% originates from methane from the storage of dairy cattle manure.
We have reviewed methane emissions from animal agriculture in the last number of posts. We cannot forget nitrous oxide emissions, especially because it is a much more powerful greenhouse gas than methane. Earlier posts discussed the significance of nitrous oxide emission from soil following fertilizer or manure application, as well as nitrous oxide emission resulting from ammonia redeposition.
Estimate of GHG emissions from animal agriculture in Abbotsford for 2011
When we put this all together into one picture, we observe a total GHG emission of 180,653 tonnes CO2 equivalent per year being emitted from animal agriculture in Abbotsford. The primary source of greenhouse gas emission methane emission from the dairy cow, followed by indirect nitrous oxide emission resulting from ammonia emission from dairy and poultry.
Only one-third of the greenhouse gas emission is methane, with less than 20% coming from the manure. Almost two-thirds of the total greenhouse gas emission is nitrous oxide, most of it resulting from indirect nitrous oxide emission due to ammonia emission from dairy and poultry facilities.
The larger picture is not complete, it is a summary of the science behind the major contributors to greenhouse gas emission from animal agriculture in British Columbia. It suggests that a more complete study should be made that includes all of our agriculture in Abbotsford in order to give a complete and balanced approach.
There are two important reasons for completing a detailed greenhouse gas emission estimate from agriculture:
1. helps set policies that provide meaningful direction for our agricultural industry
2. our communities will be allowed to include nitrous oxide emissions from agriculture and soil in the upcoming Community Emissions Inventories.
We also need to consider our policies to reduce greenhouse gas emission in the context of other environmental and health priorities in our community.
In a previous post, I had concluded that: “In developing an agricultural waste strategy for our communities, strategies to reduce greenhouse gas emissions, particularly nitrous oxide emissions, are important. Of the greenhouse gases, nitrous oxide from farmland following manure and fertilizer addition is the greatest contributor to greenhouse gas emissions from animal agriculture.” (https://johnpaulprofessional.wordpress.com/wp-admin/post.php?post=1629&action=edit) Following the European’s lead in making nutrient management plans mandatory as well as other recommendations as outlined in the previous post has the greatest likelihood of reducing overall GHG emissions in Abbotsford.
A more complete summary of the greenhouse gas emissions from animal agriculture in Abbotsford can be found here. Greenhouse Gas Emissions from Animal Agriculture in Abbotsford
Based on previous estimates of methane emission from enteric fermentation and from dairy cattle manure, the total agricultural methane emission from animals in Abbotsford can be estimated. It is also important to include estimates of methane emission from hog manure and from poultry manure.
Although hog manure is also stored anaerobically and may produce methane similar to dairy cattle manure, the hog industry has declined significantly in Abbotsford, and the potential methane emission is small.
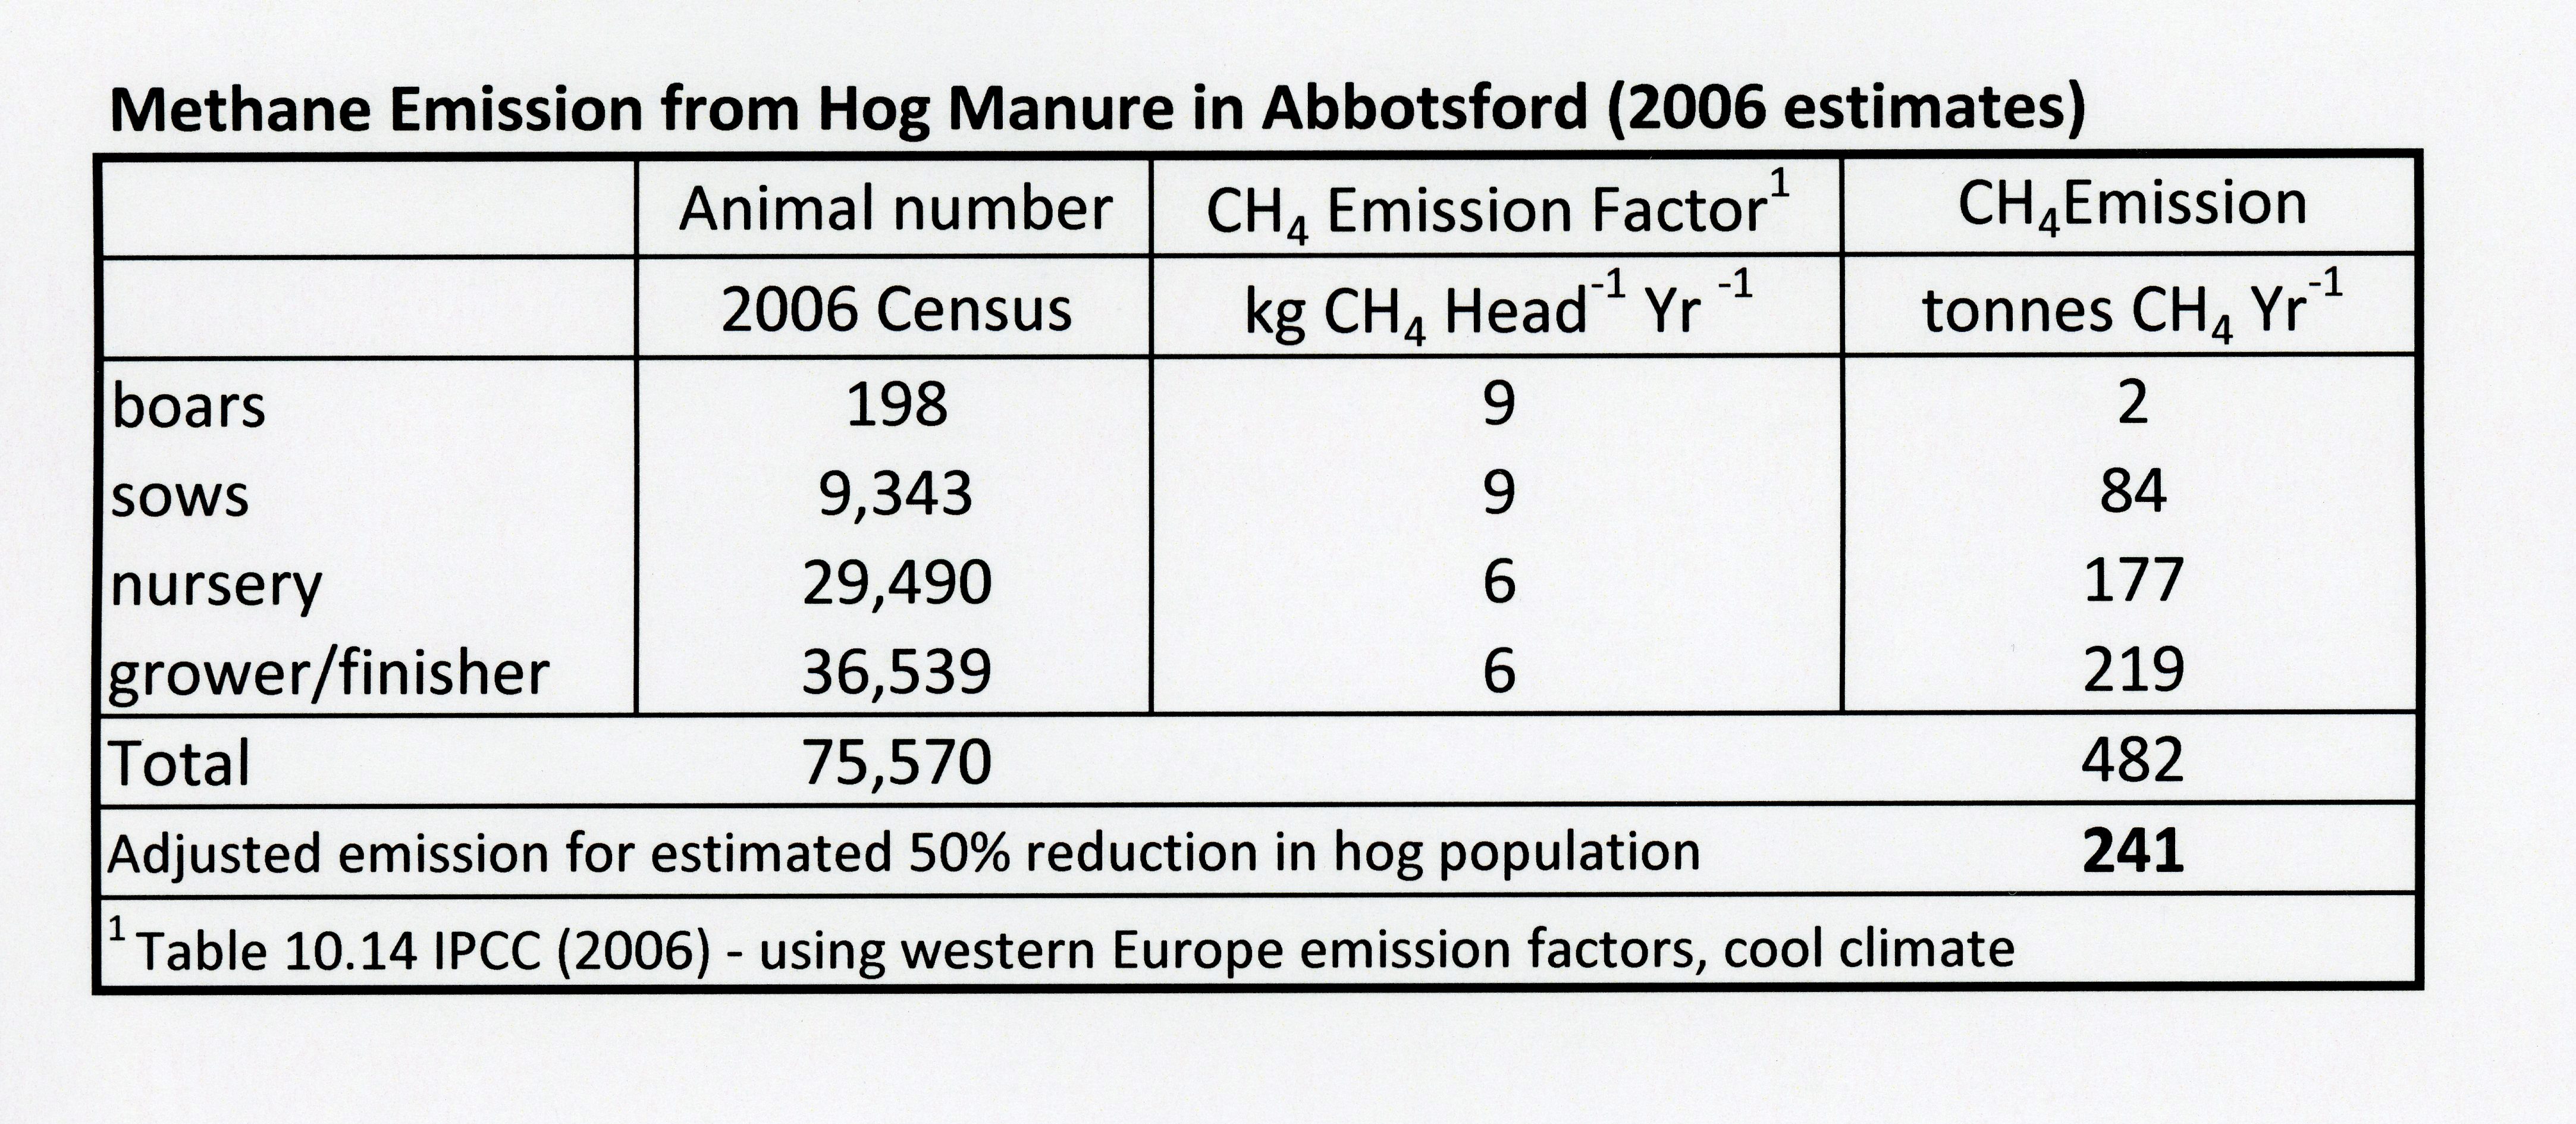
Estimated methane emission from hog manure management in Abbotsford
The poultry industry produces a significant amount of manure in Abbotsford, however, most of this manure is drier, and is managed as a solid, which is not as likely to produce methane. In addition, a significant quantity of poultry manure goes directly for mushroom substrate production, or is exported from Abbotsford and applied on land elsewhere in British Columbia.
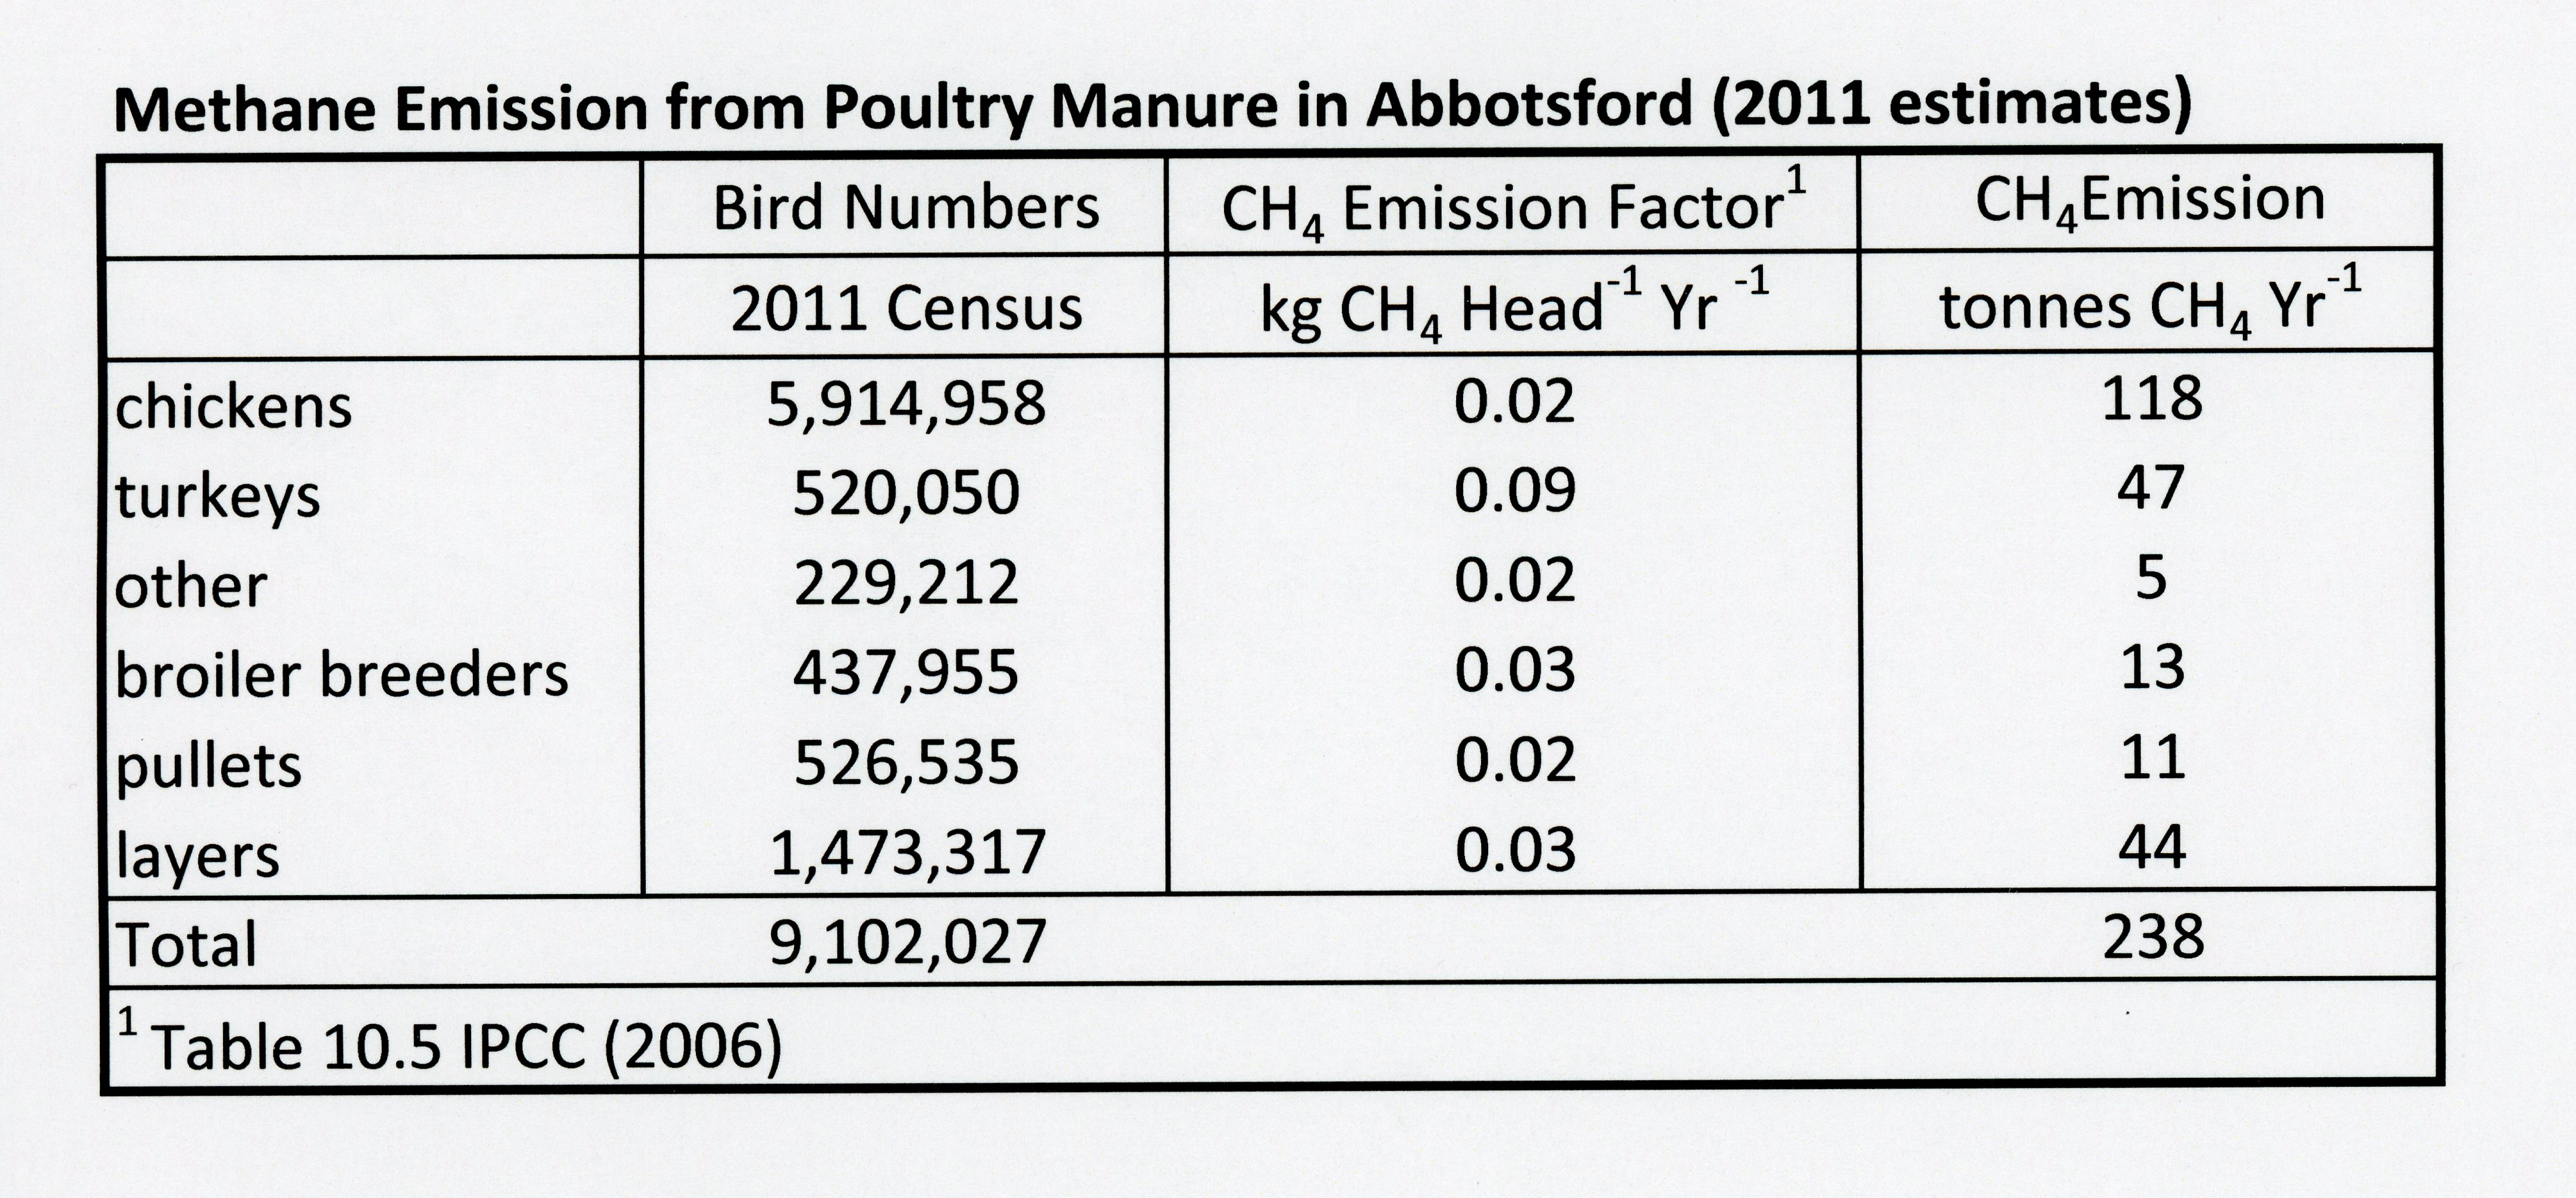
Estimate of methane emissions from poultry manure in Abbotsford
The total amount of methane produced in agriculture in Abbotsford is 66,675 tonnes CO2 equivalent, with only 12.4% originating from dairy cattle manure. The largest percentage of methane produced from the animal industry in Abbotsford is enteric methane (from the cow’s stomach), which makes up 77% of the total methane emission.

Estimate of total methane emissions from animal agriculture in Abbotsford
There has been considerable debate about the actual baseline emissions of methane, particularly from dairy cattle manure. Previous methane emission factors (MCF) have been reviewed, and concluded to be overestimates of actual methane emission rates. If we considered the previously estimated MCF of 25.8%, the total emissions from Abbotsford increase considerably to 101,094 tonnes of CO2 equivalent, with 42% coming from dairy cattle manure. Based on substantial research and our own experience, we believe the current estimates to be more accurate.
Owen and Silver (2014) developed a model of greenhouse gas emissions from dairy manure management. They suggested that the methane conversion factors used in Europe, which were similar to what was used in the Abbotsford estimates, may be underestimating the baseline methane emission. The primary focus of this study was on methane emissions from manure storage lagoons in warmer climates, which undoubtedly has significantly higher methane emission than short term storages in colder climates. What was particularly interesting about this research was the inclusion of nitrous oxide in the emission estimates. It appears that nitrous oxide has been underestimated or ignored in some areas, which may lead to agricultural policy development that may not necessarily reduce overall greenhouse gas emissions.
References
Owen, J.J., and W.L. Silver. 2014. Greenhouse gas emissions from dairy manure management: a review of field-based studies. Global Change Biology, doi: 10:1111/gcb.12687
Our dairy cattle in Abbotsford belch an estimated 2459 tonnes of methane per year, almost 7 x more than the methane coming from manure.
Methane emission from ruminant animals (including beef and dairy cattle) has been commonly known for many years, but attention to greenhouse gas implications are relatively recent. The “burp” emits approximately 87% of the methane produced in the rumen, compared with 13% emitted as flatulence from the small intestine (Murray et al. 1976). Feed additives to increase weight gain and reduce methane emission have been around for many years, but some of the products are now being promoted to reduce GHG emission from dairy and beef cattle in Canada (Boadi et al., 2004, Kebreab et al. 2006, Beauchemin and McGinn 2010). Beauchemin and McGinn (2010) suggest that methane emission from cattle could be reduced by up to 20% through diet and animal breeding.
“About 3 to 12% of the energy consumed by ruminants (cattle and sheep) is converted to methane in the rumen (referred to as enteric methane) and released into the atmosphere. Adopting feeding strategies that will minimize the amount of energy, lost as methane, can improve feed conversion efficiency, improve animal productivity, and is good for the environment.”
Most methane (CH4) that is emitted from livestock originates in the forestomach, also called the rumen, of ruminants (cattle and sheep). This source of methane is called enteric CH4. Only about 10% of the total CH4 from ruminants in Canada is from manure.” (Beauchemin and McGinn 2010).
Already in 1986, the contribution of global methane production from domestic animals and humans was estimated at 74 Tg per year, with 74% of this coming from cattle (Crutzen et al. 1986).
A research study in Canada that drew attention to methane emissions from dairy cattle was Jackson et al, (1993) where they measured an average methane emission of 542 L of methane per cow per day from a dairy barn. A review of the literature in that report indicated a wide variation in methane emissions from dairy cattle (96 to 615 L/cow/day), and agreed that variations in methane emissions from dairy cattle could be explained by differences in diet, milk yield and metabolic live weight. Aquerre et al. (2011) measured methane emissions of 538 to 648 L per lactating dairy cow per day (average weight 550 kg), where the higher methane emissions corresponded with a higher forage: concentrate ratio.
Globally, Sevenster and de Jong (2008) report that enteric methane emission (from ruminants such as cattle) produces 26% of anthropogenic methane emissions, compared to manure handling at 3%. For dairy cattle, the contribution of manure to methane emissions from dairy cattle is up to 18% (FAO 2006). They reported that Canadian dairy cattle were the highest emitter of CH4 per dairy cow at approximately 135 kg CH4 per cow, compared with less than 80 kg per cow in New Zealand. In Europe, methane emission factors used to estimate GHG emissions from dairy cattle range from 80 kg CH4 per cow in countries with more extensive dairy production to 130 kg CH4 per cow per day in countries with intensive dairy production (JRC European Commission 2010). This review reported that actual methane emissions may actually be as high as 180 kg CH4 per cow per year based on latest scientific findings and agreed IPCC methodologies. The US estimates 134.8 kg CH4 per cow per year based on Environment Canada information (US EPA 2001). Sun et al. (2008) measured 12 and 18 g CH4 per cow per hour from dry and lactating dairy cattle in California. This corresponds to 105 and 160 kg CH4 per cow per year from dry and lactating dairy cattle. Lindgren (1980) estimated that enteric methane emissions from dairy cattle increased from 123 kg CH4 per cow per year for cows giving 6000 kg of milk per year, and 136 kg CH4 per cow per year from cows giving 12,000 kg per cow per year. Kirchgessner et al. (1993) estimated that enteric methane production was 100 kg CH4 per cow per year at 6000 kg milk production and 127 kg CH4 per cow per year at 12,000. Using IPCC Tier 2 guidelines, (Sonesson et al. (2009) estimated 109 kg CH4 per cow per year at 6000 kg of milk per year, and 167 kg CH4 per cow per year at 12,000 kg of milk per year.
GHG emission is also calculated per kg of milk produced, where increasing milk production is associated with increased GHG per cow, but decreased GHG per kg of milk. Cows in Canada produce about .0175 kg CH4 per kg of milk (0.4 kg CO2 equivalent) compared to 0.03 kg CH4 per kg of milk (0.7 kg CO2 equivalent) from dairy cattle in New Zealand (Sevenster and de Jong (2008). Total GHG emissions per kg of milk are estimated at 1.4 kg CO2 equivalent in Europe (JRC European Commission 2010). The contribution of methane among countries in the EU ranged from 0.35 to 0.80 kg CO2 equivalent.
The methodology for calculating greenhouse gas emissions are governed by international law (Amon et al. 2011).
“Reporting bodies are encouraged to use more detailed methodologies than the Tier 2 approach (Tier 3) if possible and if this would result in more accurate reporting.” Amon et al. 2011.
For enteric fermentation estimates a minimal Tier II methodology is required, which consists of 1. definitions for livestock categories, 2. livestock populations by subcategory, and 3. feed intake estimates for the typical animal in each subcategory. Dong et al. (2006) provide an excellent review of the methodology for measuring GHG from livestock and manure management based on the IPCC Guidelines.
In Canada, methane emissions from dairy cattle have been modeled using IPCC Tier 2 methodology (Ominski et al. 2007). They estimated annual methane emissions of 144 kg/cow/year from dairy cattle in BC compared with a Canadian average of 126 kg/cow/year. Methane emissions from heifers in BC using IPCC Tier 2 methodology was 72 kg /animal/year. The higher methane emissions per cow in BC is offset by higher average milk production per cow. Based on recent science, the estimates of 116.5 and 74.6 kg CH4 per cow per year provided in the 2012 BC Best Practices Methodology are likely low, but are higher than the values of 73 kg CH4 per dairy cow and 46 kg CH4 per non dairy animal in the Fraser Valley Inventory (Levelton 2005).

Enteric methane emission from dairy cattle in Abbotsford
In summary, the enteric methane emission estimates of dairy cows and heifers in Abbotsford is 2459 tonnes of methane per year or 51,633 tonnes of CO2 equivalent per year. This is calculated using 2011 census data of 13,886 dairy cows and 6377 heifers, with the most recent emission factors of Ominski et al. (2007) and the IPCC 2007 CO2 equivalent (1 kg methane has the global warming potential of 21 kg carbon dioxide). This is methane emission that cannot be captured!

Our dairy cows in Abbotsford belch an estimated 2500 tonnes of methane per year, almost 7 x more than the methane coming from manure.
References
Amon, B., N. Hutchings, F.P. Vinther, P.D. Nielsen, H.D. Poulsen. I.S. Kristensen and S. Peitrzak. 2011. Analysis of methodologies for calculation greenhouse gas and ammonia emissions and nutrient balances. Eurostat Methodologies and Working Papers ISSN 197-0375.
Aquerre, M.J., M.A. Wattiaux, J.M. Powell, G.A. Broderick and C. Arndt. 2011. Effect of forage-to-concentrate ratio in dairy cow diets on emission of methane, carbon dioxide, and ammonia, lactation performance, and manure excretion. J. Dairy Sci 94: 3081-96.
Beauchemin, K.A., and S.M. McGinn. 2010. Reducing methane in dairy and beef cattle operations: what is feasible? Prairie Soils and Crops Issue 1, Article 3. www.prairiesoilsandcrops.ca
Boadi, D., C Benchaa, J. Chiquette and D. Masse. 2004. Mitigations strategies to reduce enteric methane emissions from dairy cows: Update review. Can J. Anim Sci 84: 319-335.
Crutzen, P.J, I. Aselmann and W. Seiler. 1986. Methane production by domestic animals, wild ruminants, other herbivorous fauna, and humans. Tellus. 38B: 271-284.
Dong, H., J. Mangino, T. McAllister, J.L. Hatfield, D.E. Johnson, K.R. Lassey, M.A. de Lima, and A. Romanovskaya. 2006. Emissions from livestock and manure management. Ch. 10 in 2006 IPCC Guidelines for National Greenhouse Gas Inventories.
Jackson, H.A., R.G. Kinsman, D.I Masse, J.A. Munrow, F.D. Sauer. N.K. Patni, D.J. Buckley, E. Pattey, R. Desjardins and M.S. Wolynetz. 1993. Measuring greenhouse gas emissions in a controlled environment dairy barn. ASAE Paper No. 934521.
JRC European Commission. 2010. Evaluation of the Livestock Sector’s Contribution to the EU Greenhouse Gas Emissions. Final Report. Joint Research Centre.
Kebreab, E., K. Clark, C. Wagner-Riddle and J. France. 2006. Methane and nitrous oxide emissions from Canadian animal agriculture: a review. Can J. Anim. Sci 86: 135-158.
Levelton Consultants 2005. Analysis of best management practices and emission inventory of agricultural sources in the Lower Fraser Valley. Report 404-0342 for FVRD and Environment Canada.
Murray, R.M., A.M. Bryant, and R.A. Leng. 1976. Rates of production of methane in the rumen and large intestine of sheep. Br. J. Nutr. 36: 1-14.
Ominiski, K. H. D.A Boadi, K.M. Wittenberg, D.L. Fulawka, and J.A. Basarab. 2007. Estimates of enteric methane emissions from cattle in Canada using IPCC Tier-2 methodology. Can. J. Anim. Sci 87: 459-467.
Sevenster, M, and F. de Dong. 2008. A Sustainable Dairy Sector: global, regional and lifestyle facts and figures on greenhouse gas emissions. CE Delft Solutions for Environment, Economy and Technology, Delft, Netherlands.
Soneson, U. C. Cederberg, and M. Berglund. 2009. Greenhouse Gas Emissions in Milk Production. Decision support for climate certification. Klimatmarkning Format Report 2009:3 Denmark
Sun, H., S.L. Trabue, K. Scoggin, W.A. Jackson, Y. Pan, I.L. Malkina, J.A. Koziel, and F.M. Mitloehner. 2008. Alcohol, volatile fatty acid, phenol and methane emissions from dairy cows and fresh manure. J. Environ. Qual. 37: 615-22.
US EPA. 2001. Emissions from Animal Feeding Operations. US Environmental Protection Agency. EPA Contract No. 68-D6-0011.
In this post, we estimate baseline methane emission from dairy manure storage in Abbotsford to be 8278 tonnes CO2 equivalent, using internationally accepted protocols for calculating baseline methane emissions from manure storage.
“Some countries for which livestock emissions are particularly important may wish to go beyond the Tier 2 method and develop models for country-specific methodologies or use measurement–based approaches to quantify emission factors. The method chosen will depend on data availability and national circumstances. Good practice in estimating CH4 emissions from manure management systems entails making every effort to use the Tier 2 method, including calculating emission factors using country-specific information. The Tier 1 method should only be used if all possible avenues to use the Tier 2 method have been exhausted and/or it is determined that the source is not a key category or subcategory.” (IPCC 2006).
The following four steps are used to estimate CH4 emissions from manure management (IPCC 2006)::
Step 1: Collect population data from the Livestock Population Characterization (see Section 10.2)
Step 2: Use default values or develop country-specific emission factors for each livestock subcategory in terms of kilograms of methane per animal per year.
Step 3. Multiply the livestock subcategory emission factors by the subcategory populations to estimate subcategory emissions, and sum across the subcategories to estimate total emissions by primary livestock species.
Step 4: Sum emissions from all defined livestock species to determine national emissions.
Calculation of methane emissions from manure storage (IPCC 2006)
The dairy industry developed a methane emissions protocol where methane emission from manure storage (tonnes CO2 eq per year) = kg DM/head/day of volatile solids excretion from a specific animal group x number of animals in group x 365 days per year x maximum methane producing capacity from dairy manure (Bo – default is 0.24 m3 of methane per kg of volatile solids) x methane conversion factor (% of volatile solids converted to methane under storage conditions) (Atlantic Dairy and Forage Institute 2008, and Government of Alberta 2010). They suggested that methane emissions could be calculated monthly to account for influence of temperature and timing of manure removal. They report the methane conversion factor for British Columbia as 25.8% (which came from Verge et al. 2007).
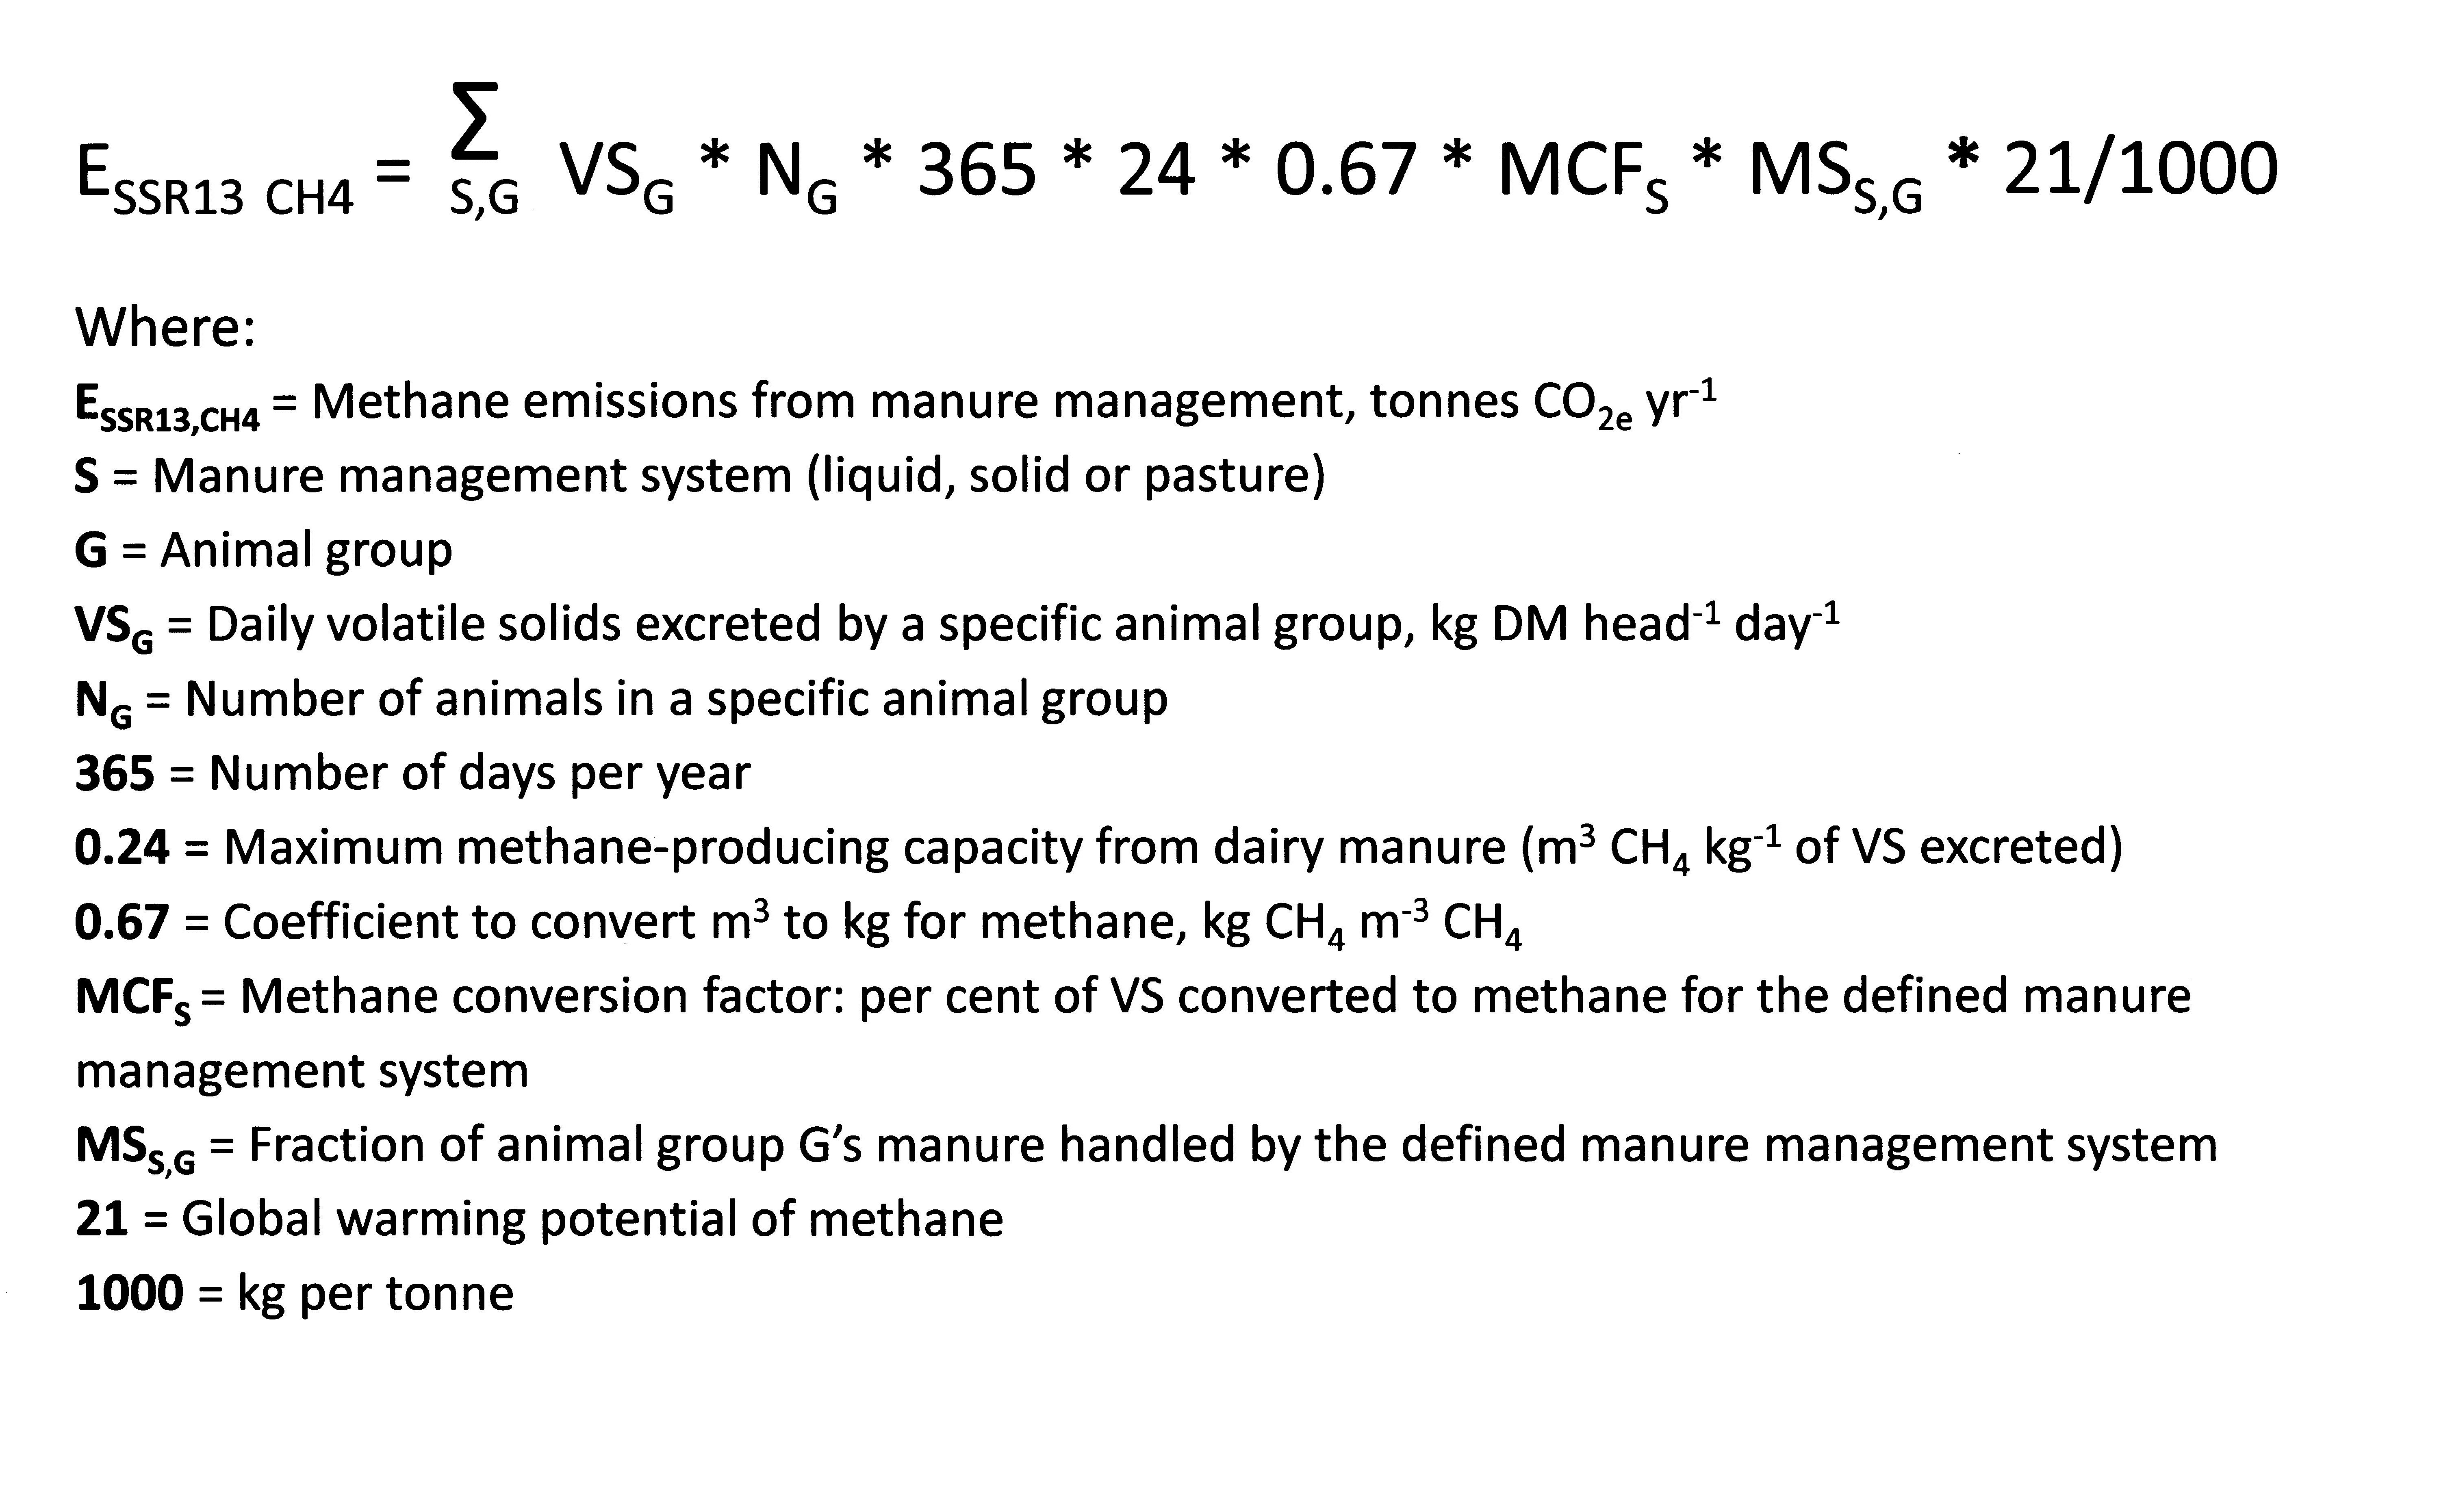
Equation for measuring methane emission from manure storage in Canada (Govt of Alberta 2010)
Two numbers required are the daily volatile solid excretion per specific animal group (VS), and the maximum methane producing capacity from dairy manure (Bo). Washington State uses a VS excretion of 8.35 and 4.07 kg dry VS per animal per day (US EPA 2010). They also use a Bo of 0.24 for dairy cows and 0.17 for dairy heifers. The default volatile solids excretion (VS) in Europe used is 5.08 and 2.65 for dairy cattle and non-dairy cattle, respectively (Amon et al 2005). They use the same Bo values of 0.24 and 0.17 for dairy cattle and non dairy cattle. The average VS excretion used in Austria is 3.86 kg per animal per day, however, milk production rates are also lower than in western Canada. Holler et al. (2004) measured an average VS excretion of 4.08 kg per lactating dairy cow er day. Weiss and St-Pierre (2010) summarized data from experiments on lactating dairy cattle in Ohio showing average VS excretion of 8.57 kg dry matter per animal per day. They found that as feed intake increased, VS also increased because the feed went through the animal faster and efficiency of digestion decreased. They concluded that “A Holstein cow producing 23 kg of milk averages about 59 kg of manure (2.6 kg of manure/kg of milk) but a Holstein producing 45 kg of milk produces 80 kg of manure or only 1.75 kg of manure/kg of milk. Increasing milk production is usually the most effective means of decreasing manure output per unit of milk produced.”
The Bo value refers to the ultimate methane yield, which is lower than the theoretical methane yield because some of the manure volatile solids are used to produce microbial biomass and lignin containing compounds will only be degraded to a limited degree (Holler et al. 2004). IPCC (2006) uses a default Bo value of 0.24 and 0.17 m3 of CH4 per kg VS for dairy cows and dairy heifers, respectively. The US EPA (2010) has adopted these same values. Holler et al. (2004) measured Bo values of 0.148 during actual experiments with dairy cattle manure in Denmark.

Baseline calculations of methane emissions during manure storage from Abbotsford’s 13,886 dairy cows and 6,377 heifers.
The total methane (CO2 equivalents) from dairy manure management in Abbotsford ranges from 2,970 tonnes using conservative factors to 42,717 tonnes using a high MCF factor used in some previous estimates. My professional opinion based on the science that we have reviewed and current manure management practices is 8,278 tonnes total greenhouse gas emission from methane emission during manure storage.
Using the total of 8,278 tonnes total greenhouse gas emission from methane, the methane emission per cow during manure storage is 24 kg. This compares with Bertrand and Hacala (2007), who summarized the IPCC 1997 methane emission factors as: North America dairy cow 36 kg/head/yr compared to the Western Europe dairy cow at 14 kg/head/yr under cool climate conditions (Abbotsford is considered cool climate conditions). A report by Sonesson et al. (2009) used experimental data of 11.4-12.4 kg per cow per year methane loss during manure storage in Northern Europe, suggesting that the estimated methane emissions still may be overstated.
References
Amon, B., M. Frolich, K. Hopfner-Sixt and T. Amon. 2005. Emission inventory for the agricultural sector in Austria: state of the art and future developments. In Kuscynski, T., U. Dammgen, J. Webb and A. Myzcko, eds. Emissions from European Agriculture. pp. 147-179.
Atlantic Dairy and Forage Institute. 2008. Greenhouse Gas Protocol for the Canadian Dairy Industry. http://www.adfiresearch.org/GHG/Appendix_C.pdf
Bertrand, S., and S. Hacala. 2007. Generation and sources of greenhouse gases in the dairy industry. In Reduction of Greenhouse Gas Emissions at Farm and Manufacturing Levels. Bulletin of the International Dairy Federation 422/2007.
Government of Alberta. 2010. Quantification Protocol for Emission Reductions from Dairy Cattle. Specified Gas Emitters Regulation. Version 1.0
Holler, H.B., S.G. Sommer and B.K Ahring. 2004. Methane productivity of manure, straw and solid fractions of manure. Biomass and Bioenergy 26: 485-495.
IPCC. 2006. 2006 IPCC Guidelines for National Greenhouse Gas Inventories. Volume 4. Agriculture, Forestry and Other Land Use. Chapter 10. Emissions from Livestock and Manure Management. http://www.ipcc-nggip.iges.or.jp/public/2006gl/pdf/4_Volume4/V4_10_Ch10_Livestock.pdf
Karimi-Zindashty, Y., J.D. MacDonald, R.L. Desjardins, D.E. Worth, J.J. Hutchinson, and X.P.C. Verge. 2012. Sources of uncertainty in the IPCC Tier 2 Canadian livestock model. Journal of Agricultural Science 150:556-559.
Sonesson, U., C. Cederberg and M. Berglund. 2009. Greenhouse gas emissions in beef production. Klimatmarkning For Mat. 2009-4.
US EPA 2010. Code of Federal Regulations. Title 40. Protection of the Environment. Part 98. Mandatory Greenhouse Gas Reporting. Subpart JJ Manure Management. http://cfr.vlex.com/vid/98-368-definitions-300325402
Verge, X.P.C., J.A. Dyer, R.L. Desjardins and D. Worth. 2007. Greenhouse gas emissions from the Canadian dairy industry in 2001. Agricultural Systems 94: 683-693.
Weiss, W.P., and N. St-Pierre. 2010. Feeding strategies to decrease manure output of dairy cows. WCDS Advances in Dairy Technology 22: 229-237.
Based on our climate and manure management practices, methane emission from dairy manure storages is 5-10% of the potential emissions, and ranges from 3000 to 10,000 tonnes of carbon dioxide equivalents per year.
It is important to estimate the baseline methane emissions from manure storages in order to calculate any potential greenhouse gas emissions savings gained by implementing anaerobic digestion.
We have reviewed the science on methane emissions from manure stored at cooler temperatures based on both Canadian and European research. We have reviewed manure management systems on dairy farms in Abbotsford. A key factor in estimating actual methane emissions from dairy manure storages in Abbotsford is the methane emissions factor (MCF).
Baseline methane emissions from manure storages are calculated using internationally accepted protocol. They are estimated by measuring the number of animals, the amount of volatile solids excreted by each animal, the potential methane production per kg of volatile solids, and the methane conversion factor (MCF). This MCF is a percentage between 0 and 100%, where 100% is equal to the potential methane production per kg of volatile solids. The MCF is primarily a function of manure storage temperature and the length of time that manure is stored. There are a wide range of MCF values used, ranging from 39% used for the Vanderhaak digester in Lynden WA (Washington State 2008), to 25.8% used in British Columbia (Verge et al. 2007, Janzen 2009, Government of Alberta 2010). The internationally accepted IPCC protocols (IPCC 1996, IPCC 2006) use an MCF value of 10% for liquid manure storage in cool climates.
It is important to note here that IPCC (2006) suggests a MCF of 68% for unovered anaerobic lagoon (Table 10.17). Table 10.18 of (IPCC 2006) has additional important information on the definition of uncovered anaerobic lagoon: “A type of liquid storage system designed and operated to combine waste stabilization and storage. Lagoon supernatant is usually used to remove manure from the associated confinement facilities to the lagoon. Anaerobic lagoons are designed with varying lengths of storage (up to a year or greater), depending on the climate region, the volatile solids loading rate, and other operational factors. The water from the lagoon may be recycled as flush water or used to irrigate and fertilise fields.” While there are a number of uncovered anaerobic lagoons in Abbotsford, the storage capacity in most cases is less than 6 months as per a review in a previous post. The higher MCF for anaerobic lagoons also assumes a signficant effect of inoculation of methane forming bacteria during long term storage. Sommer et al. (2007) reported that methane production from stored cattle manure was not significant at 10 C, even when the manure was inoculated.
Washington State used an MCF of 39% (Washington State 2008). “Using the Intergovernmental Panel on Climate Change (IPCC) Tier 2 methodology for estimating methane emissions from liquid/slurry manure storage facilities and a methane conversion factor of 39 percent for cool climates” (Washington State 2008). This number comes from IPCC (2000) Table 4.11 MCF values for manure management systems not specified in the IPCC Guidelines (Judgement by Expert Group). However, if we go to manure management systems actually specified in the IPCC (1996) Guidelines, Table 4.8 clearly identifies the MCF factor for liquid manure systems in cool climates at 10%, not 39%. So, where did the MCF of 39% come from? It came from a supporting paper for the IPCC (1996) by Zeemans and Gerben (1997), which includes information by Zeemans (1994). Its interesting to note that Zeemans (1994) concludes: “when continuously 15% of the storage is filled, no gas production is produced, at a temperature of 15°C and a storage capacity < 100 days and at a temperature of 10°C and a storage capacity < 150 days.” We have to conclude based on this information, that the MCF of 10% may even overestimate actual methane emission from manure storages under conditions in Abbotsford. Soliva (2006) also considered the 39% and 10% default MCF values reported in IPCC (2000) and made the same conclusion that 10% was the more realistic value for manure management in Switzerland.
The MCF factor of 25.8% for manure storages in British Columbia came originally from a paper by Verge et al. (2007). They state that this value was based on a US paper that extrapolated optimal methane emission at various temperatures using the van’t Hoff-Arrhenius equation. There was no experimental data used in this calculation, and differential temperature response by various microbes was not taken into account. We know from previous posts that the methane producing bacteria are more sensitive to temperature than the acid formers and that VFA and ammonia accumulation may inhibit the methane producting bacteria in a manure storage. Based on the fact that this MCF value of 25.8% is theoretical only, and is not supported by actual data either in Canada or in Europe, there is no evidence that this value is relevent to manure management in British Columbia.
Based on actual measurements of methane emissions at low temperatures and our manure storage management in British Columbia, and using the rule of conservancy, a realistic MCF factor is 5%. This also fits with our actual measurements of methane emission from manure storages in 2004. However, I suggest that we could potentially accept the IPCC (1996) and IPCC (2006) MCF value of 10%. Rodhe et al. (2009) estimated that the MCF for dairy manure in Sweden was 3%, based on shorter manure storage periods, and frequent manure applications during the summer. Karimi-Zindashty et al. (2012) concluded that obtaining parameters specific to regions and animal subcategories is very important in order to estimate GHG emissions more accurately and to reduce the uncertainties in agricultural GHG inventories.
Understanding the actual methane emissions from manure storages becomes important when estimating any methane emission reduction resulting from anaerobic digestion. The estimated 3000 to 10,000 tonnes CO2 equivalent of methane emission from manure storages is significantly lower than the 55,000 tonnes CO2 equivalent emitted directly from the dairy cattle (to be reviewed in a following post).
We have to be careful not to misunderstand where the methane comes from with animals and animal manure, and how much can be recovered.
References
Government of Alberta. 2010. Quantification Protocol for Emission Reductions from Dairy Cattle. Specified Gas Emitters Regulation. Version 1.0
IPCC. 1996. Revised 1996 IPCC Guidelines for National Greenhouse Gas Inventories. Reference Manual Volume 3. Chapter 4. Agriculture. http://www.ipcc-nggip.iges.or.jp/public/gl/guidelin/ch4ref2.pdf
IPPC. 2000. Good Practice Guidance and Uncertainty Management in National Greenhouse Gas Inventories. J. Penman, D. Kruger, I. Galbally, T. Hiraishi, B. Nyenzi, S. Emmanul, L. Buendia, R. Hoppaus, T. Martinsen, J. Meijer, K. Miwa, and K. Tanabe (Eds). Institute for Global Strategies, Japan.
IPCC. 2006. 2006 IPCC Guidelines for National Greenhouse Gas Inventories. Volume 4. Agriculture, Forestry and Other Land Use. Chapter 10. Emissions from Livestock and Manure Management. http://www.ipcc-nggip.iges.or.jp/public/2006gl/pdf/4_Volume4/V4_10_Ch10_Livestock.pdf
Janzen, R. 2009. Science Discussion Paper – Certification of a Greenhouse Gas Protocol and Calculator for the Canadian Dairy Industry. http://www.adfiresearch.org/GHG/Appendix_B.pdf
Karimi-Zindashty, Y., J.D. MacDonald, R.L. Desjardins, D.E. Worth, J.J. Hutchinson, and X.P.C. Verge. 2012. Sources of uncertainty in the IPCC Tier 2 Canadian livestock model. Journal of Agricultural Science 150:556-559.
Mangino, J., D. Bartram and A. Brazy. 2001. Development of a methane conversion factor to estimate emissions from animal waste lagoons. Technical Report 14 pp. http://www.epa.gov/ttnchie1/conference/ei11/ammonia/mangino.pdf
Rodhe, L., Ascue, J. and Nordberg, Å. 2009. Emissions of greenhouse gases (methane and nitrous oxide) from cattle slurry storage in Northern Europe. IOP Conference Series: Earth and Environmental Science 8.
Soliva, C.R. 2006. Report to the attention of IPCC about the data set and calculation method used to estimate methane formation from enteric fermentation of agricultural livestock population and manure management in Swiss agriculture. Federal Office for the Environment, Berne, Switzerland.
Sommer, S.G., S.O. Petersen, P. Sorensen, H.D. Poulsen and H.B. Moller. 2007. Methane and carbon dioxide emissions and nitrogen turnover during liquid manure storage. Nutrient Cycling in Agroecosystems 78: 27-36.
Verge, X.P.C., J.A. Dyer, R.L. Desjardins and D. Worth. 2007. Greenhouse gas emissions from the Canadian dairy industry in 2001. Agricultural Systems 94: 683-693.
Washington State. 2008. Climate Action Team. Draft Development of Potential Offsets Related to Anaerobic Digestion. Agricultural Sector Carbon Market Workgroup.
Zeeman, G., and S. Gerbens. 1997. CH4 Emissions from Animal Manure. In Good Practice Guidance and Uncertainty Management in National Greenhouse Gas Inventories.
Zeeman, G. 1994. Methane production/emission in storage’s for animal manure. Fertilizer Research 37: 207-211.
Dairy manure storages in Abbotsford emit less methane than manure storages elsewhere in Canada, mostly because of the shorter storage time. In a previous post, we saw that storage temperature dramatically influences methane emission. This post looks at the storage methods and timing as they also affect the baseline methane emissions from manure. Liquid manure storage produces more methane than solid manure storage. A longer storage period increases the amount of methane emitted. Dairy farms in Abbotsford are unique in Canada for two reasons:
- almost all dairy farms in Abbotsford utilize liquid manure systems
- the average manure storage period is lower than the Canadian average because manure can be applied to grassland during the late fall and early spring.
We have to consider regulation and best management practices. According to the BC Ministry of Agriculture (2009), “an offset project must result in GHG reductions beyond existing or proposed regulatory requirements / industry standards.”
An applicable regulation is the Agricultural Waste Control Regulation (2002), where it states:
“A storage facility must
(a) be of sufficient capacity to store all the agricultural waste produced or used on the farm for the period of time needed to allow for
(i) the application of agricultural waste as a fertilizer or soil conditioner, or
(ii) the removal of agricultural waste,
(b) prevent the escape of any agricultural waste that causes pollution, and
(c) be maintained in a manner to prevent pollution.”
The BC Ministry of Agriculture published the Environmental Guidelines for Dairy Producers (BC Ministry of Agriculture 1993). This document was intended to “describe management options that are environmentally sound, and which comply with existing Federal and Provincial environmental laws.” The recommended manure storage time in this document was a minimum of six months in order to “store the manure during the times of the year when manure cannot be applied to cropland due to the risk of causing pollution.” This document allows for some manure application on grassland during all months of the year, and up to 40% of the annual allowable application between September and December.
The BC Ministry of Agriculture (2004a) states that “Manure is considered to be a fertilizer. The growth characteristics and nutrient requirements of crops should be carefully considered before fertilizing. Manure should be spread onto cropland when chemical fertilizer would normally be spread.” (BC Ministry of Agriculture 2004). They stated that manure may need to be stored from 5 to 7 months depending on the location in the province and the local weather conditions. BC Ministry of Agriculture 2004b) states that “manure spreading is not permitted in late fall and winter, to avoid sensitive fisheries stages and periods of high rainfall.”
The BC Ministry of Agriculture recommends four to six months manure storage (BC Ministry of Agriculture 2006). “For most BC farms, four months is recommended and six months may be most desirable. Up to one year may be required depending on the crop planted and the ability to fertilize with manure. Sufficient length of storage should be provided to avoid spreading manure on land when there is a danger of runoff.”
The Manure Spreading Advisories (BC Ministry of Agriculture 2012) also provide guidance to maintain industry standards. “Manure application on perennial grasses is usually appropriate until the end of October as long as crop growth and warmer weather patterns (greater than 5oC) continue; fields are trafficable; and precipitation does not create runoff….Plan manure applications to empty storage facilities before the rainy season.” (BC Ministry of Agriculture 2012 September manure advisory)
Manure is an excellent fertilizer source if managed properly. It is advised to apply manure throughout the growing season to meet crop nutrient uptake patterns and to keep pits empty before the start of the rainy season. (BC Ministry of Agriculture 2012 August manure advisory). BC Ministry of Agriculture (2010) provides guidance to when manure should be applied, which is 100% of available manure for corn production during April before corn planting, and up to 25% of available manure application in September if a cover crop is planted after corn production. For grassland, up to 25% of the annual manure production can be applied in late February or early March, and up to 70% during the growing season up to September after grass cutting.
Because most dairy farms grow both corn and grass, the maximum potential manure storage requirement is 4 to 6 months. Manure storages should be emptied in March or April for corn production, and emptied throughout the summer for grass production, and to allow the storage facilities to be empty at the start of the rainy season in October.
From a methane emission perspective, this is important as we can expect accumulation of manure from an empty manure storage during October through February when the temperature is cold and minimal methane emission is expected. From April through September, the recommendation is to utilize the manure as the grass crops are harvested, which essentially suggests that the manure storage time is less than 1 month.
The dairy industry in BC is unique in Canada. A research report based on 2003 statistics suggested that: “Most farms with liquid manure storage had a storage capacity of more than 250 days. Furthermore, 9.9% of farms had liquid storage capacity with more than 400 days.” (Statistics Canada 2003). In a table showing manure storage by herd size, 31% percent of dairy farms in Canada stored manure as a liquid in 2003. In British Columbia, 65% of dairy farms used primarily liquid manure storage. 14% of farms in Canada had manure storage capacity less than 150 days (approx. 5 months). In 1997 in Abbotsford, the median storage time on dairy farms in Matsqui was 3.3 months compared with 3.6 months in Sumas (Environment Canada 1997). Essentially all of the dairy farms in Abbotsford store their manure as a liquid.
The average amount of manure storage on dairy farms in Abbotsford appears to be approximately 6 months. Rising and Palmer (1996) found that 30% of dairy farms in Abbotsford (Matsqui and Sumas) had less than 2 months capacity for manure storage, and 50% had less than 3 months manure storage. They suggested that “manure storage was the most critical factor in the environmentally sustainability of the dairy farms in the Lower Fraser Valley.” They evaluated several different environmental sustainability factors and concluded that dairy “farms were operated at at about 60% of the recommended environmentally sustainability level and the water quality in the surface waters was ranked in the worst 50% of the monitored surface waters in British Columbia.” There has been a significant increase in manure storage capacity on dairy farms since 1996, particularly with public funding provided through ARDCorp, and it appears that most farms have approximately 6 months of storage capacity.
Because the dairy industry and manure management practices are unique in southcoastal BC, it is recommended that we estimate a methane conversion factor that matches the regional conditions. This will be estimated in the next post.
References:
BC Ministry of Agriculture. 1993. Environmental Guidelines for Dairy Producers in British Columbia. Prepared in cooperation with the BC Federation of Agriculture and the Dairy Industry of BC.
BC Ministry of Agriculture. 2004a. Manure Storage and Use. Strenthening Farming – Right to Farm Order No. 870.218-44. http://www.al.gov.bc.ca/resmgmt/fppa/refguide/activity/870218-44_Manure_Storage.pdf
BC Ministry of Agriculture. 2004b. Fertilizers and Soil Conditioners. Strenthening Farming – Right to Farm Order No. 870.218-37. http://www.al.gov.bc.ca/resmgmt/fppa/refguide/activity/870218-37_Fertilizers.pdf
BC Ministry of Agriculture. 2006. Manure Storage Structures. Farm Structures Factsheet. Order no. 383.000-1. http://www.agf.gov.bc.ca/resmgmt/publist/300Series/383000-1.pdf
BC Ministry of Agriculture. 2009. BC’s Agricultural Sector and the Greenhouse Gas Reduction Targets Act.
BC Ministry of Agriculture. 2020. Nutrient Management Reference Guide. Canada-British Columbia Environmental Farm Plan Program. BC Agricultural Research and Development Corporation. http://www.agf.gov.bc.ca/resmgmt/EnviroFarmPlanning/EFP_Nutrient_Guide/Nutrient_Mgmt_Guide_2010_documents/NutrientMgmt_RefGuide.pdf
BC Ministry of Agriculture. 2012. Manure Spreading Advisory #4 2012: South Coast Region Sept 6, 2012. http://www.agf.gov.bc.ca/resmgmt/ManureAdvisory/index.htm
BC Ministry of Agriculture. 2012. Manure Spreading Advisory #3 2012: South Coast Region August 1, 2012. http://www.agf.gov.bc.ca/resmgmt/ManureAdvisory/index.htm
BC Ministry of Environment. 2002. Agricultural Waste Control Regulation. http://www.bclaws.ca/EPLibraries/bclaws_new/document/ID/freeside/10_131_92
Environment Canada. 1997. Sumas and North Matsqui Watersheds. 1997. Farm Practices Survey. Fraser River Action Plan. DOE FRAP 1997-48. http://research.rem.sfu.ca/frap/9748.pdf
Palmer, M., and N. Rising. 1996. The development of an environmental sustainability parameter for agriculture. Canadian Water Resources Journal. 21: 13-25
Statistics Canada. 2003. Manure Storage in Canada. Vol 1 No. 1. Farm Environmental Management in Canada. http://publications.gc.ca/Collection/Statcan/21-021-M/21-021-MIE2003001.pdf
Methane production is dramatically effected by manure temperature, resulting in very little methane emissions from manure storages in Abbotsford.
Jackson et al. (1994) measured biogas emission from 200 L manure storage containers in Ottawa during May through September and measured biogas containing 25% methane. They concluded that methane emission from the manure storage was approximately 3% of the total emission from the dairy cows and the manure combined (the other 97% was enteric methane production). They observed that the methane production rate was 10% of that reported by other researchers, which they attributed to lower manure temperatures than those reported in the other studies, although they reported an average manure temperature of 17 C.
Patni et al. (1995) reported similar methane emissions from a farm scale manure storage during the summer, and significantly lower emissions during the winter months. They measured 27% methane in the biogas during the summer and 22 to 35% during the winter (normally biogas is 60-75% methane). They concluded that
“insufficient time and low slurry temperatures, and possibly other inhibitory factors such as high volatile acid and ammonia concentrations, did not permit methanogenic bacteria to become dominant in the stored slurry. Introduction of an inoculum acclimatized to low temperature could conceivably increase the methane content in the biogas….Farm-stored DCMS in cold climatic regions is unlikely to be a significant contributor of greenhouse gases into the atmosphere.”
Masse et al. (2003) measured the effect of storage time, solids content and temperature on methane emissions during storage of dairy cattle manure. They observed that significant methane production only occurred after 180 days of storage at 15 C, with total methane emission rates more than 10 times higher at 15 C than 10 C. They also measured more methane emission from diluted manures, which they attributed to less inhibitory VFA and ammonia in this manure. They concluded that
“CH4 emissions depend on the interaction between a number of variables, including physico-chemical characteristics and type of manure, temperature, and storage duration. Results also indicated that on typical Canadian farms, CH4 emissions from manure storage tanks over the late fall, winter, and early spring period should be very small, because manure temperature remains substantially below 10°C….During the late spring, summer, and early fall period, CH4 emissions from manure tanks could be substantially reduced by recommending storage periods shorter than 150 days and frequent land applications. The use of below ground storage tanks would also contribute to maintain lower manure temperatures during the summer and thus minimise CH4 emissions.”
How about research elsewhere in the world? Do we see similar patterns?
Zeeman (1994) developed a model of methane emissions from animal manure storages in the Netherlands based on temperature. He concluded negligible gas production during storages of less than 100 days at 15 C, and less than 150 days at 10C.
Umetsu et al. (2006) concluded that methane emission from manure storage tanks during late fall, winter and early spring in northern Japan may be negligible because of manure temperatures less than 10 C.
Sommer et al. (2007) concluded that methane emission from liquid cattle manure stored for 100-200 days was not significant at temperatures below 15 C, and that inoculation of the manure significantly increased methane emissions at higher temperatures.
Rodhe et al. (2009) measured methane emissions from on-farm dairy manure storages in Sweden. Gas emissions were measured from October through April as the storage was being filled until the storage tank was almost emptied in April, then again from May through September while the storage tank was being filled. Mean slurry temperatures were 9.7 and 5.6 C in southern and northern Sweden, respectively. During a controlled experiment throughout the year in one location, they measured a methane conversion factor (MCF) of 2.2 and 4.1 during the winter and the summer, respectively. They averaged this value at 3%, which was much lower than the IPCC value of 10% (25.8% used in BC, and 39% used for the Vanderhaak dairy in Washington). We will discuss the methane conversion factor in greater detail in a later blog.
Klevenhusen et al. (2010) measured methane emissions from dairy cattle slurry for a 15 week period at 14 C and 27 C. They concluded that the methane conversion factor (MCF) ranged from .88 to 1.81 at 14 C and 11.9 to 19.9 at 27 C.
Moller et al. (2003) observed that the theoretical methane emission potential (MCF) during a 90 day storage period of liquid dairy cattle manure at 15 and 20 C was 2.6 and 3.3%. They observed that methane emission began to increase after 90 days at 20 C, but not at 15 C.
Moller et al. (2012) measured methane emissions from manure stored at various temperatures from dairy cattle fed different diets. They made 3 significant observations:
- At 35 C, when the manure was inoculated, methane emission was essentially complete after 90 days.
- At 35 C, when the manure was not inoculated, there was up to a four-fold variation in methane emission depending on diet (corn>corn+fat>grass), and methane emissions appeared to be complete after 125 days.
- At 10 and 20 C, respectively, methane emission over a 225 day period was 6 and 13% of the methane emission at 35 C.
Dammgen et al. (2012) provided a review of methane emissions from cattle manure storages in Europe. They concluded that there is a wide consensus that methane emissions from stored slurry at air temperatures below 10 C are small in comparison to slurry stored at higher temperatures.

We confirmed that CH4 emission from manure storages in Abbotsford was very low during our winters already in 1994.
In summary, the methane coming from our liquid dairy cattle manure storages may not be very much in south coastal British Columbia. In the next post, we will address how our manure storage practices also influence the low methane emission rates.
References
Amon, B, V. Kryvoruchko, T. Amon and S. Zechmeister-Boltenstern. 2006. Methane, nitrous oxide and ammonia emissions during storage and after application of dairy cattle slurry and influence of slurry treatment. Agriculture, Ecosystems and Environment 112: 153-162.
Dammgen, U., B. Amon, N.J. Hutchings, H-D Haenel and C. Rosemann. 2012. Data sets to assess methane emissions from untreated cattle and pig slurry and solid manure systems in the German and Austrian emission inventories. Agriculture and Forestry Research 2012 62:1-20.
Jackson, H.A., N.K. Patni, D.I. Masse, R.G. Kinsman, M.W. Wolynetz, D.J. Buckley, J.A. Munroe, F.D Sauer, R. Desjardins and E. Pattey 1994. Measuring greenhouse gas emission from dairy manure slurry. ASAE Paper No. 944540.
Klevenhusen, F., S.M. Bernasconi, M. Kreuzer and C.R. Soliva. 2010. Experimental validation of the Intergovernmental Panel on Climate Change default values for ruminant-derived methane and its carbon-isotope signature. Animal Prod. Sci. 50: 159-167.
Masse, D.I, F. Croteau, N.K. Patni and L. Masse. 2003. Methane emissions from dairy cow and swine manure slurries stored at 10C and 15 C. Can. Biosystems Eng. 45: 6.1-6.6.
Moller, H.B., S.G. Sommer and B.K. Ahring. 2004. Biological degradation and greenhouse gas emissions during pre-storage of liquid animal manure. J. Environ. Qual. 33: 27-36.
Moller, H.B., S. Sarker, A.L Frydendahl Hellwin and M.R. Weisbjerg. 2012. Quantification of methane production and emission from anaerobic digestion of cattle manure derived from different feeding. http://cigr.ageng2012.org/images/fotosg/tabla_137_C0327.pdf
Patni, N. H. Jackson, D. Masse, M. Wolynetz and R. Kinsman. 1994. Greenhouse gas release from stored dairy cattle manure slurry. Proceedings of the 7th International Symposium on Agricultural and Food Processing Wastes. ASAE.
Rodhe, L. J. Ascue, and A. Nordberg. 2009. Emissions of greenhouse gases (methane and nitrous oxide) from cattle slurry storage in Northern Europe. Beyond Kyoto: Addressing the Challenges of Climate Change. IOP Conf. Series: Earth and Environmental Science 8: 012019.
Sommer, S.G., S.O. Petersen, P. Sorensen, H.D. Poulsen and H.B Moller. 2007. Methane and carbon dioxide emissions and nitrogen turnover during liquid manure storage. Nutrient Cycling in Agroecosystems: 78: 27-36.
Umetsu, K., Y. Kimura, J. Takahashi, T. Kishimoto, T. Kojima, and B. Young. 2006. Methane emission from stored dairy manure slurry and slurry after digestion by methane digester. An. Sci. J. 76: 73-79.
Zeeman, G. 1994. Methane production/emission in storages for animal manure. Fertilizer Research 37: 207-211.
Greenhouse gas emission from our manure storages in Canada is relatively small due to our colder climates and manure management systems. It is now 30 years since I first began my research with greenhouse gas production from agriculture, which began with a conversation with Dr. Naveen Patni in Ottawa in 1985.
Dr Patni’s findings in the early 1980s (Patni and Jui 1985) is more profound now, with the increased interest in greenhouse gas emissions. At the time, we discussed the effect of temperature on volatile fatty acid accumulation, the disappearance of the volatile fatty acids later in the summer, and the pH of the manure throughout the year. The ideas coming from this one research paper affect our understanding of both methane and nitrous oxide emissions from animal manure, and to anaerobic digestion including:
- Biogas from manure is a two stage process, the first being the production of organic acids (VFA), primarily acetic acid, and the second being methanogenesis by methane producing bacteria – who are much more sensitive to temperature, as well as to ammonia and propionate accumulation in the manure.
- VFA production also produces carbon dioxide – the manure carbon is the electron acceptor to form VFAs and hydrogen – this is why we see high carbon dioxide, low methane in manure studies at low temperature
- Methane production is a much slower process and is affected by storage time and temperature
- Although one would expect VFA production to lower manure pH (like a silage), it doesn’t because protein breakdown releases ammonia which raises pH
- When methane producing bacteria begin to produce methane, we observe a pH increase due to loss of the VFA
- pH of manure is high after biodigestion because of the loss of VFA and the accumulation of ammonia/ammonium
- We can expect lower N2O after biodigestion because we have removed the VFA or the available carbon which increases N2O emission during both nitrification and dentrification
This conversation greatly influenced my research. The following comes directly from my MSc thesis, completed in 1988.
“Anaerobic digestion to methane involves a two stage process, the acidogenic stage and the methanogenic stage. Cellulose, hemicellulose, lipids and proteins are degraded to volatile acids, hydrogen, and carbon dioxide during the first, or “acid forming” phase. The volatile fatty acids are converted to methane and carbon dioxide by the methanogenic bacteria in the second phase of anaerobic digestion.
Mosey (1983) summarized the acid forming phase of anaerobic digestion during carbohydrate fermentation. He stated that the preferred product of fermentation was acetic acid. The production of propionic and butyric acids were the bacterial response to an increasing acid load and a decreasing redox potential.
Farm slurries differ from anaerobic digesters in that the conditions are rarely optimum for the second phase of anaerobic digestion, methanogenesis. The result is that high concentrations of volatile fatty acids accumulate in the manure. The methane formers grow at slower rates and are more sensitive to adverse conditions than the acid formers.
Methane is not produced in most anaerobic manure storage tanks in Canada because the temperature is below optimum, the loading rate of the manure is too high, inhibiting methanogenesis by allowing toxic concentrations of volatile acids and ammonium to accumulate.
Van Velsen (1977) concluded that methanogens adapt to high ammonium concentrations, but are inhibited when the rate of ammonium formation is more rapid than the ability of the methane formers to acclimatize to the change.
Ianotti and Fischer (1983) measured the effects of volatile fatty acids on the growth of methanogens isolated from a swine manure digester. They found propionic acid to be more toxic to methanogens than either acetic or butyric acids. Van Velsen (1977) also observed digester failure when the propionic acid began to accumulate.
Methanogens are also sensitive to pH. In some anaerobic digesters, failure of the digester results in decreased pH as a result of organic acid production. This is not a problem with most manure digesters because of the high concentrations of ammonium in the manure. Schmid and Lipper (1969) observed only a slight decrease in pH when the organic acid concentration increased to 15,000 mg per L in a swine manure digester. They concluded that the high concentration of ammonium buffered the manure pH near neutral.” (Paul 1988)
We measured a direct correlation between manure slurry pH and volatile fatty acid concentration in various liquid dairy cattle, swine, beef and poultry manure slurries sampled during May in Ontario. (Paul and Beauchamp 1989). The data suggests that very little methane production had occurred.
There are suggestions that the methane production process is a more complicated one than simply the two stage process described: the acid forming stage and the methane forming stage. The reality is that there is a very diverse and fascinating group of microbes operating to allow methane production to occur. Lyberatos and Skiadas (1999) have a great summary of various models of anaerobic digestion. There are some slightly different versions of a four step methane production process.
The acidogenic microbial community is not as sensitive to temperature as the conversion of volatile fatty acids to methane, hence we see an accumulation of volatile fatty acids in many liquid manure storage tanks, without the corresponding methane production.
We will review research on the temperature affects on methane production during manure storage, with the goal of estimating methane production from our manure storages in Abbotsford.
References
Ianotti, F.L and J.R. Fischer. 1983. Effects of ammonia, volatile acids, pH and sodium on growth of bacteria isolated from a swine manure digester. Dev. Ind. Microbiol. 25:741-747.
Lyberatos, G., and L.V. Skiadas. 1999. Modelling of anaerobic digestion – a review. Global Nest: the Int J. 1: 63-76
Mosey, F.E. 1983. Mathematical modelling of the anaerobic digestion process: regulatory mechanisms for the formation of short chain volatile acids from glucose. Water Sci. Tech. 15: 209-232.
Patni, N.K. and P.Y. Jiu. 1985. Volatile fatty acids in stored dairy cattle slurry. Agricultural Wastes 13: 159–178.
Paul, J.W. 1988. Fermentation products of manure and plant residues as carbon sources for denitrifying bacteria in soil. M.Sc thesis. University of Guelph.
Paul, J.W. and E.G. Beauchamp. 1989. Relationship between volatile fatty acids, total ammonia and pH in manure slurries. Biol. Wastes. 29: 313-318.
Schmid, L.A. and R.I Lipper 1969. Swine wastes, characterization and anaerobic digestion. In Animal Waste Management: Cornell Univ. Conf. Agric. Waste Management. R.C. Loehr, chair pp. 50-57.
Van Velsen, A.F. M. 1977. Anaerobic digestion of piggery waste. 1. Influence of detention time and manure concentration. Neth. J. Agric.Sci 25: 151-169
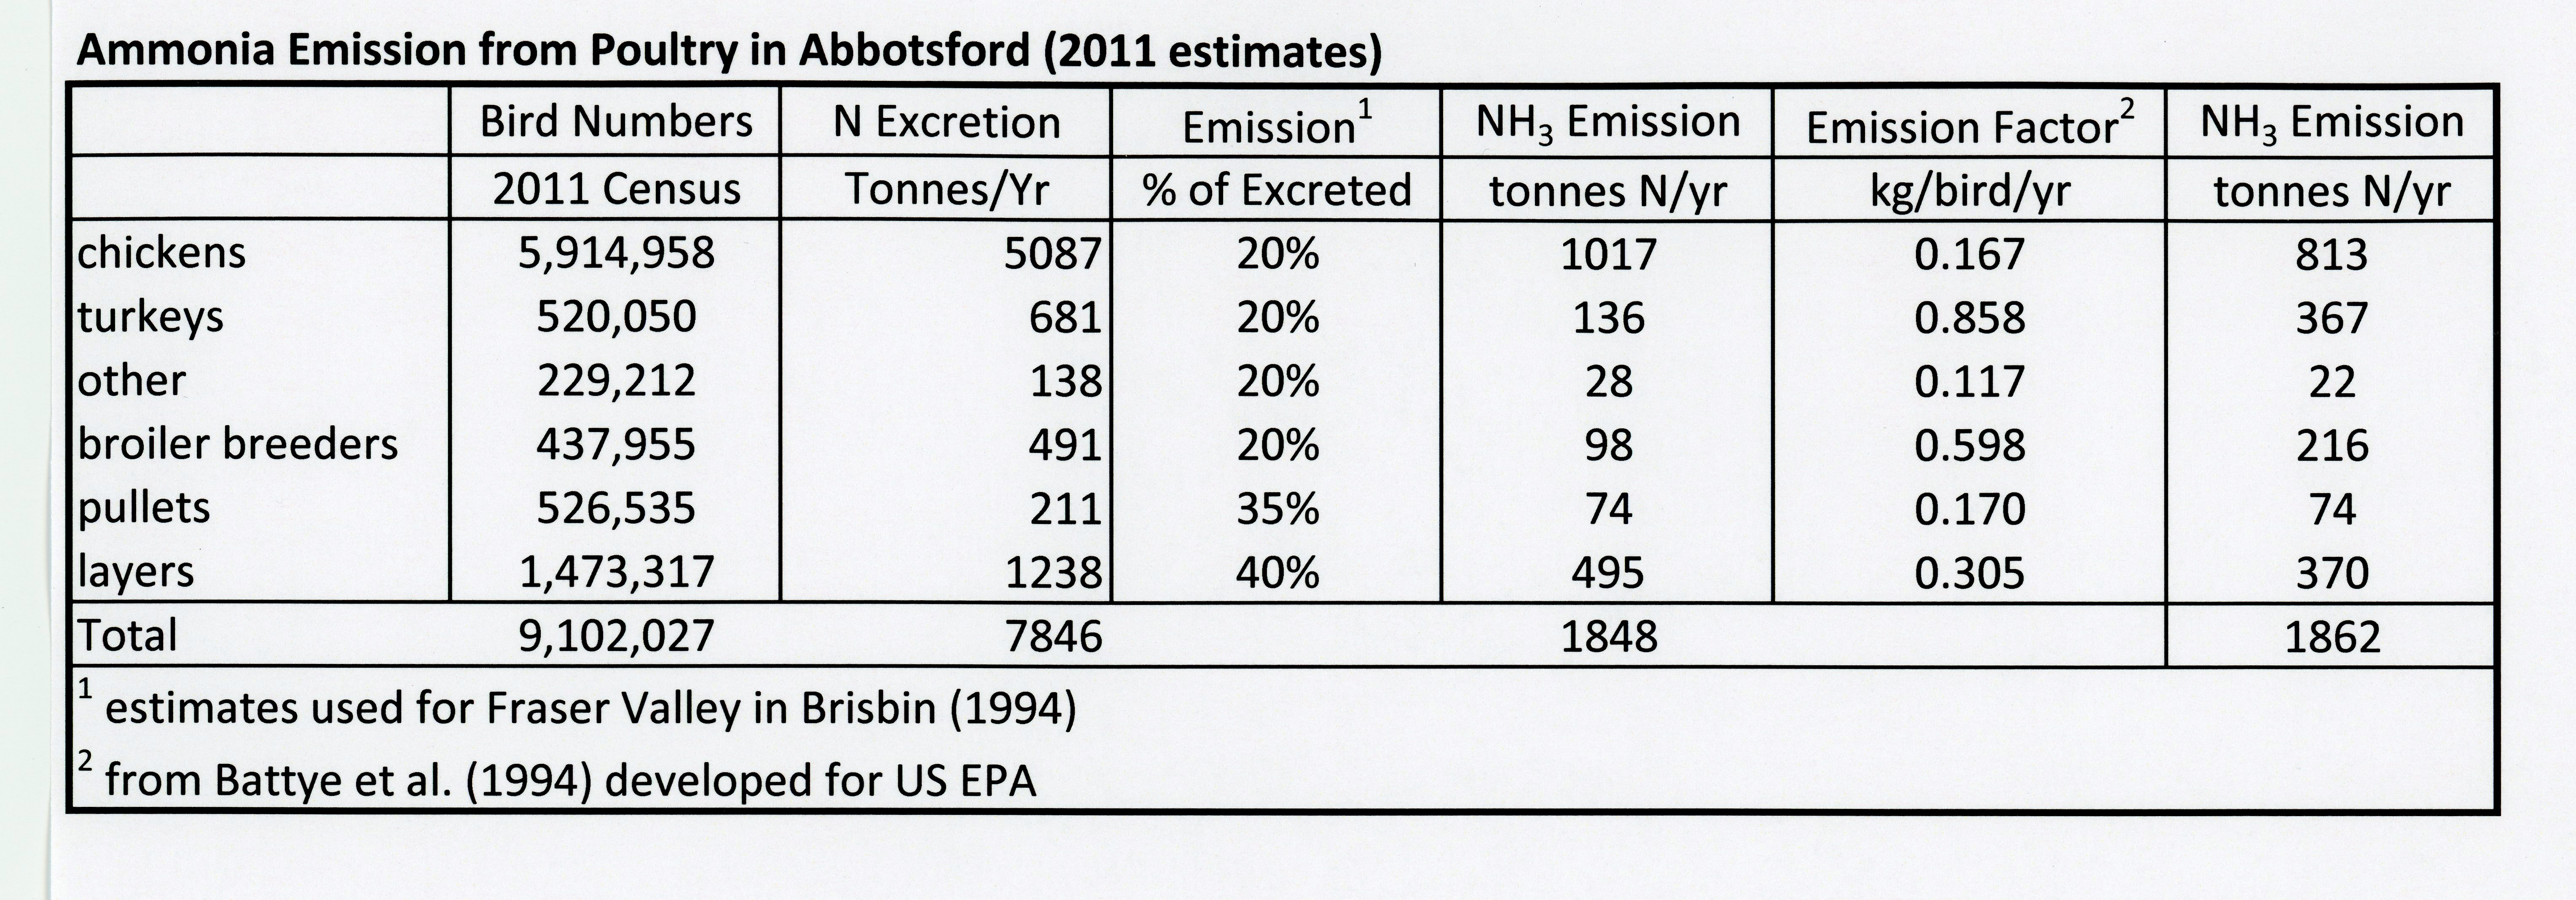
Poultry farms in Abbotsford emit an estimated 1862 tonnes of ammonia, resulting in an equivalent of 11,023 tonnes CO2 equivalent GHG emission.
One of the sources of ammonia emission in Abbotsford is our poultry farms. Bittman et al. (2010) provided ammonia deposition measurements during and after the Avian Flu in 2004, where the poultry farms were depopulated. They observed that ammonia emission and deposition increased rapidly in some areas shortly after repopulation. Brisbin (1994) estimated 20% losses of excreted N as ammonia from broiler production and up to 40% losses from layer production. The rationale for the lower emission rate with broiler production was that inclusion of bedding reduced ammonia losses. The US EPA (2004) estimated that the average ammonia emission from poultry (including broilers, layers and turkeys) was 31% of N excreted.
Our objective here is to verify ammonia emission rates during poultry production, and provide an estimate of total ammonia emission from poultry production in Abbotsford. This emission rate can also be used to estimate indirect N2O emissions.
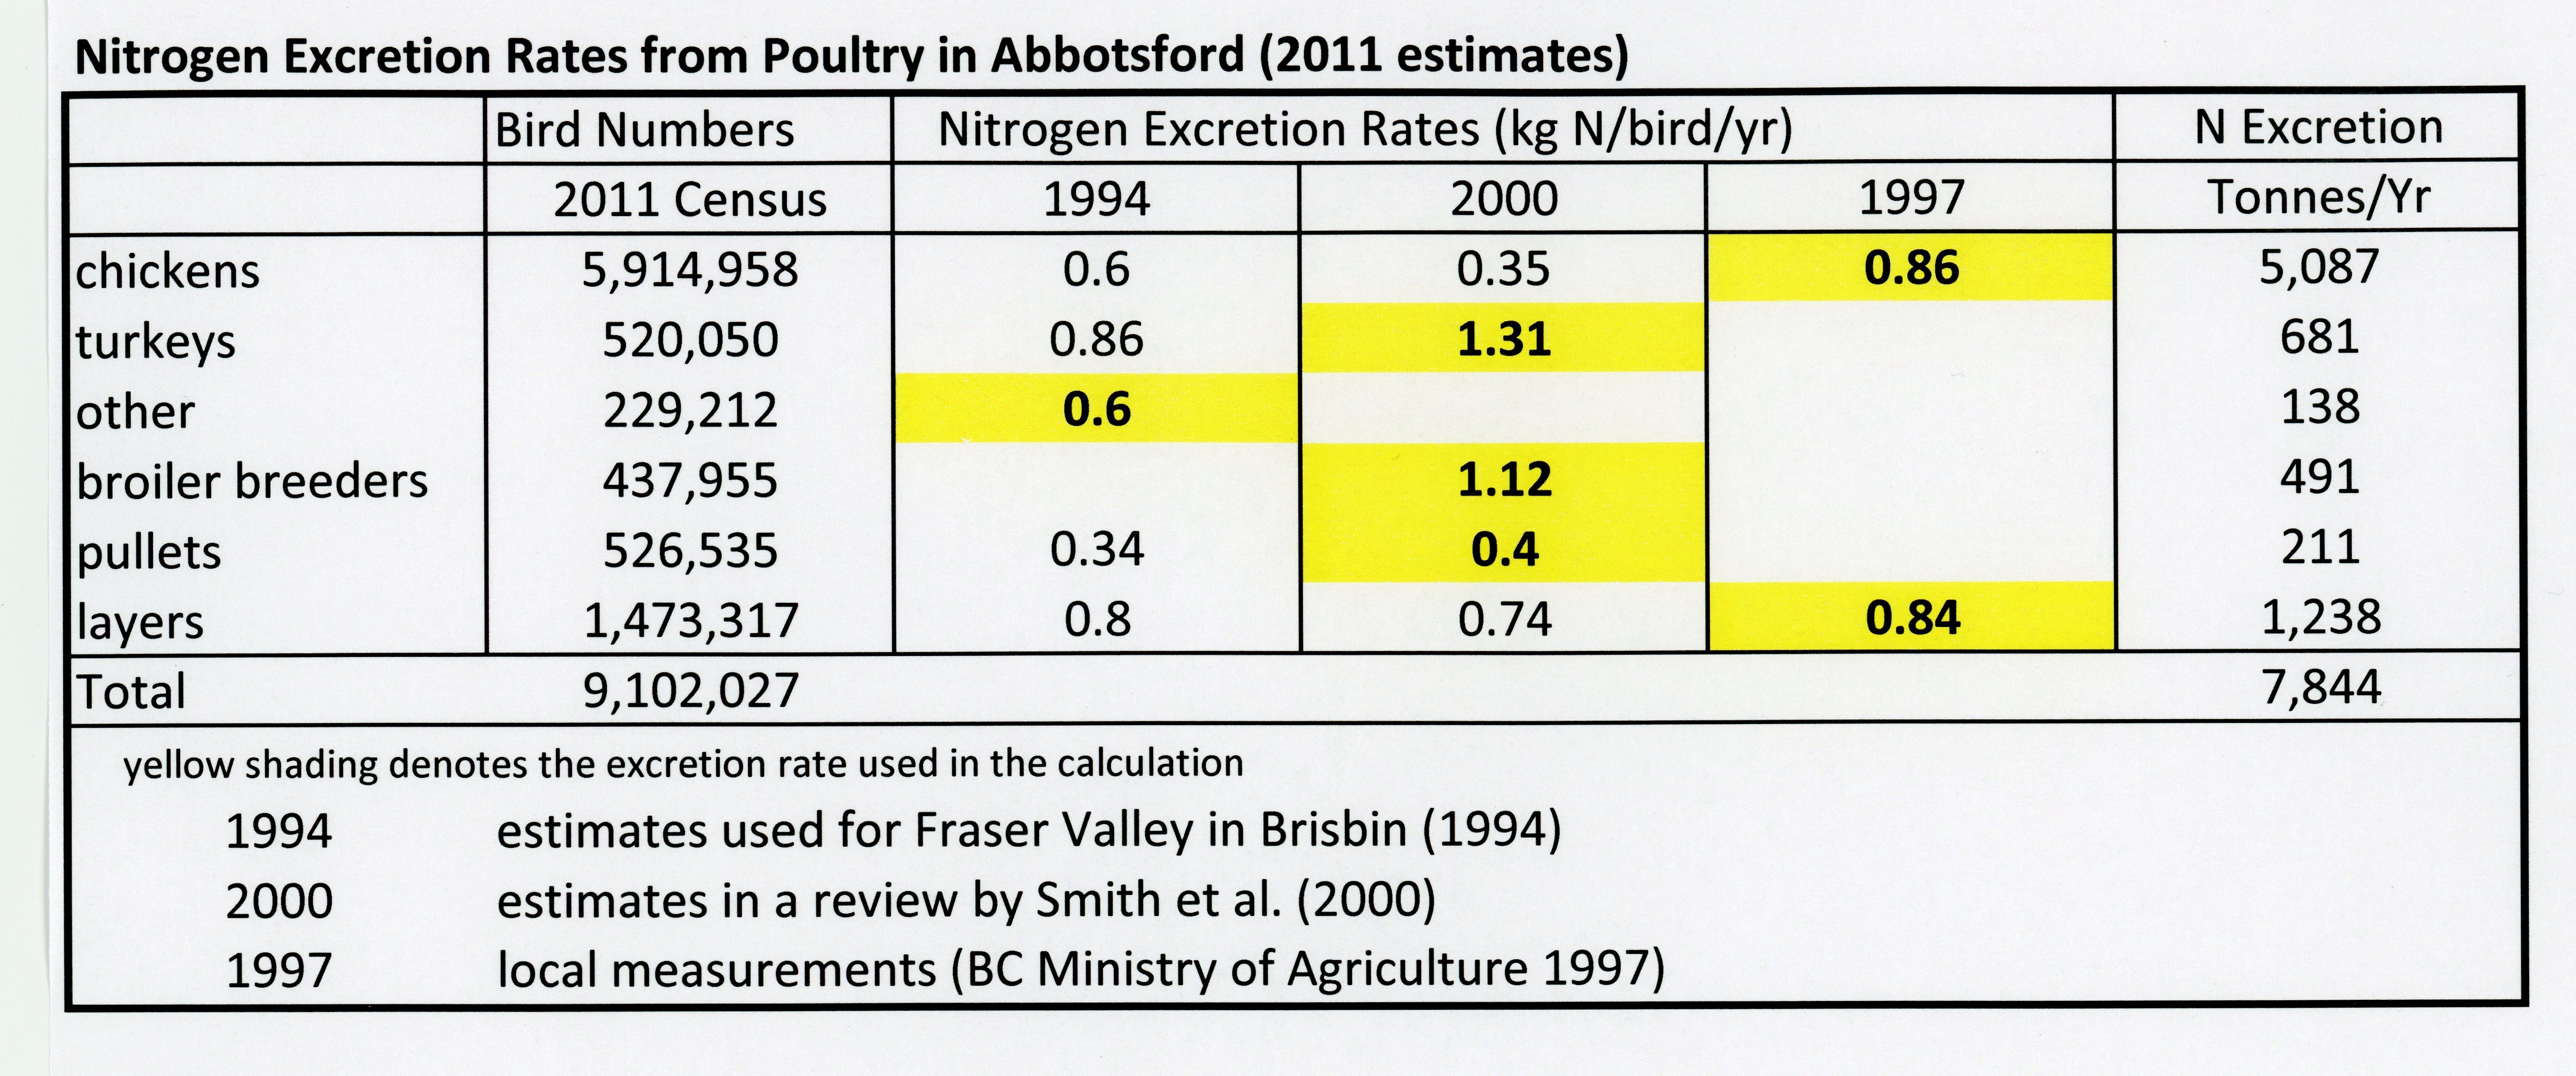
Nitrogen Excretion Rates from Poultry in Abbotsford
There are variations in nitrogen excretion rates from poultry. I have provided a few estimates from the literature to update the 1994 N excretion rates in the attached table. To estimate the N excretion from poultry in Abbotsford, I used the 2011 census data and the best N excretion rates available (local preferred, otherwise most recent).
The greatest amount of nitrogen is excreted during poultry broiler production (5,087 tonnes of N per year) because of the high animal population, followed by poultry layers (1,238 tonnes of N per year), plus additional N excreted from other poultry types. The amount of N excreted as manure from poultry in Abbotsford per year is estimated at 7,844 tonnes.
Nitrogen excretion by poultry in Abbotsford
Ammonia Emission from Poultry Broiler Production
In the 1994 nutrient balance study of agriculture in the Fraser Valley, ammonia emission during poultry broiler production was estimated at 20% of N excreted. Paul et al. (1997) reported ammonia emission rates of 15% of total N fed to broiler chickens and 24.8% of the excreted N. Nitrogen use efficiency by the birds was 43.2%. Ammonia emissions from broiler production were estimated at 8.1% of nitrogen intake or about 15% of N excretion in southern California (Harper et al. 2010).
Calvet et al. (2011) calculated an average ammonia emission of 19.7 and 18.1 mg/hour per bird during broiler production in southern Europe during the summer and winter, respectively. This corresponds to 15% of N excreted based on N excretion rates of 0.86 kg per bird per year equivalent.
Battye et al. (1994) suggested an emission factor of 0.167 kg NH3 per broiler per year. In a review of the literature, Ritz et al. (2004) reported ammonia emissions rates of 2 to 22% of N excreted (based on N excretion rates of 0.86 kg per bird per year). Prescatore et al. (2005) reported that in Europe, ammonia emissions are estimated at approximately 20% of N excreted, based on replacing bedding after every cycle. They found that ammonia emissions increased up to 50% when more than one cycle of broilers was raised on the same bedding.
It is important to note that both increased moisture content and increased temperature will increase ammonia emissions (Miles 2013 and Miles et al. 2013). We can expect that our humid winters in particular will increase the potential for ammonia emission.
Based on the additional research on ammonia emissions during poultry broiler production, we will continue to estimate ammonia emissions from the barn at 20% of N excreted.
Ammonia Emission from Poultry Layer Production
Battye et al. (1994) summarized the literature and estimated a N emission rate of 0.305 kg NH3 per poultry layer per year, or 30% of N excreted if we assume an N excretion rate of 0.84 kg N per bird. The US EPA (2004) estimated 0.4 kg NH3 or 40% of N excreted.
Ammonia emission during poultry layer production appears to vary with the type of manure management. Fournel et al. (2012) reported NH3 emissions of 0.032 kg/yr/hen with a manure belt system compared with emissions of 0.389 kg/hen/yr with a deep-pit system. Liang (2006) reported an average NH3 emission of 0.31 kg/hen/yr from 4 deep pit poultry layer systems compared with 0.02 kg/hen/yr from two layer barns using manure belts. Wang et al. (2009) reported ammonia emission rates ranging from 0.026 to 0.135 kg from manure belt laying systems and was dependent on the time interval for manure removal from the barn.
Brisbin (1994) did not note any manure belt systems for layer operations, and that most of the layer operations used solid pits with no fans to dry the manure. We will assume similar management, therefore the estimated N emission of 40% will still be current.
Ammonia Emission from Poultry in Abbotsford
Using the 2011 Census data, the N excretion rates calculated above based on a review of literature, and the ammonia emission factors used in the 1994 study (Brisbin 1994), we can calculate the estimated ammonia emission from poultry production in Abbotsford. For comparison, we used the emission factors developed by Battye et al. (1994) used for the US EPA. The two estimates happen to be remarkably close at 1848 and 1862 tonnes ammonia-N per year.
Ammonia emission from poultry production in Abbotsford
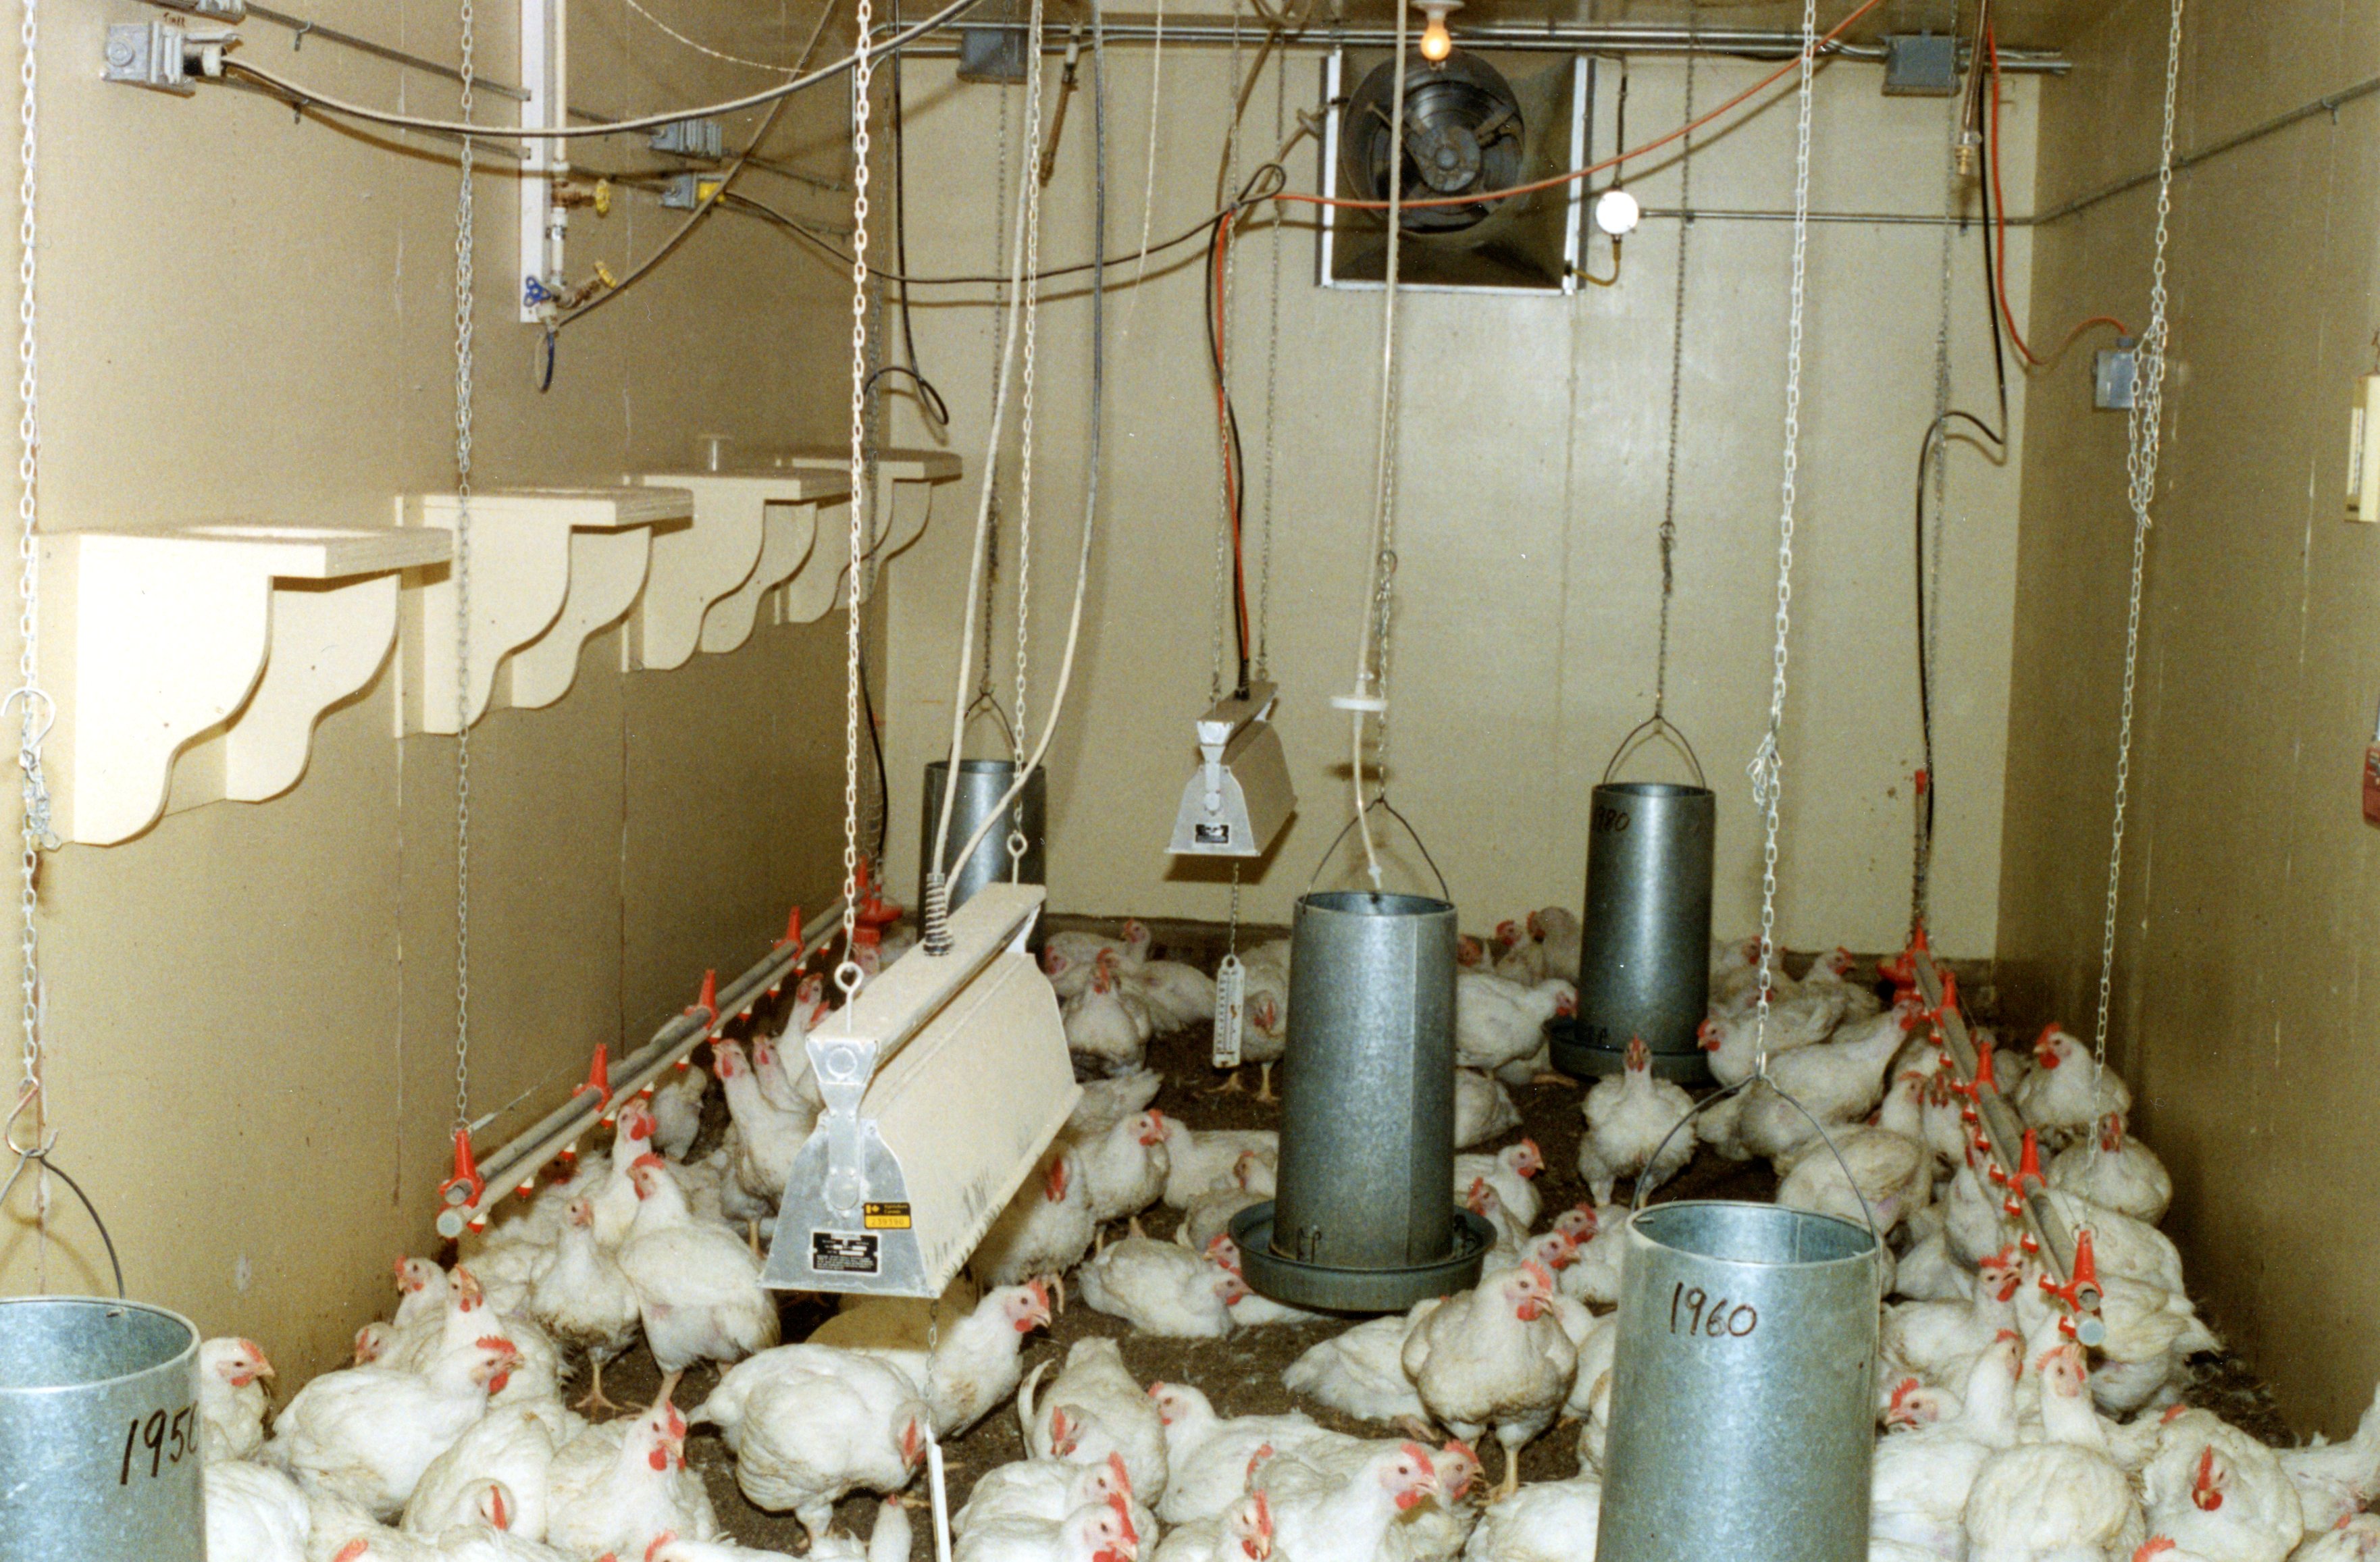
We measured ammonia emissions during broiler production in four separate rooms at the research center in Agassiz. We measured the effect of improved diets and addition of adsorbents to the litter.
Ammonia Emission Contributes to Nitrous Oxide Emission
The Intergovernmental Panel for Climate Change guidelines recommended including ammonia emissions in greenhouse gas calculations. The estimated the indirect effect of NH3 emission on nitrous oxide production to 2% (IPCC 2006). Given the estimates of 1862 tonnes per year of ammonia emission from poultry housing, and given that the carbon dioxide equivalent of nitrous oxide is 296 times, we have a total of 11,023 tonnes of CO2 equivalent greenhouse gas emissions resulting from ammonia emissions in our poultry barns. We can use this number later in estimates of greenhouse gas emissions from agriculture in Abbotsford.
References
Battye, R. W. Battye, C. Overcash and S. Fudge. 1994. Development and selection of ammonia emission factors. Final report for US EPA.
Bittman, S., J. Tait, D. Hunt, S. Sheppard, K. Chipperfield and Q. Zheng. 2010. Ammonia emission inventory for farms in the Lower Fraser Valley with detailed spatial and temporal resolution. 15th International Union of Air Pollution Prevention and Environmental Protection Associations’ World Clean Air Congress, Vancouver, BC Sept 2010. http://events.awma.org/IUAPPA/presentations/5D/a151.pdf
BC Ministry of Agriculture. 1997. Minimizing Pollution from Poultry Manure: 1. Nitrogen. Poultry Factsheet. http://www.al.gov.bc.ca/poultry/publications/documents/nitrogen.pdf
Brisbin, P.E. 1997. Agricultural Nutrient Management in the Lower Fraser Valley. DOE FRAP 1995-27. Environment Canada.
Calvet, S., M. Cambra-Lopez, F. Estelles and A.G. Torres. 2011. Characterization of gas emissions from a Mediterranean broiler farm. Poultry Science 90: 534-542.
Fournel, S., F. Pelletier, S. Godbout, R. Laglace and J.J.R. Feddes. 2012. Odour emissions, hedonic tones and ammonia emissions from three cage layer housing systems. Biosystems Engineering 112: 181-191.
Harper, L.A., T.K. Flesch and J.D. Wilson. 2010. Ammonia emissions from broiler production in the San Joaquin Valley. Poultry Science 89: 1802-1814.
IPCC. 2006. 2006 IPCC Guidelines for National Greenhouse Gas Inventories. Volume 4. Agriculture, Forestry and Other Land Use. Chapter 10. Emissions from Livestock and Manure Management. http://www.ipcc-nggip.iges.or.jp/public/2006gl/pdf/4_Volume4/V4_10_Ch10_Livestock.pdf
Liang, Y., H. Xin, H. Li, R.S. Gates, E.F. Wheeler and K.D. Casey. 2006. Effects of measurement intervals on estimation of ammonia emissions from layer houses. Transactions of the ASABE 49: 183-186.
Miles, D.M. 2013. Poultry litter moisture management to reduce ammonia. LivestockGRACEnet. USDA http://www.ars.usda.gov/SP2UserFiles/Program/212/LivestockGRACEnet/LitterMoisture.pdf
Miles, D.M., J.P. Brooks, M.R. McLaughlin and D. E. Rowe. 2013. Broiler litter ammonia emissions near sidewalls, feeders and waterers. Poultry Science 92: 1693-1698.
Pescatore, A.J. K.D. Casey and R.S. Gates. 2005. Ammonia emissions from broiler houses. Journal of Applied Poultry Research 14: 635-637.
Paul, J.W., T.A. Scott and P.K. Barton. 1997. Ammonia emissions and nitrogen balances during poultry broiler production. Pacific Agri-Food Research Centre – Agassiz. Technical Report # 133. January 1997.
Ritz, C.W., B.D. Fairchild and M.P. Lacy. 2004. Implications of ammonia production and emissions from commercial poultry facilities: A review. Journal of Applied Poultry Research 13: 684-692.
Sirri, F. and A. Meluzzi. 2012. Effect of sequential feeding on nitrogen excretion, productivity, and meat quality of broiler chickens. Poultry Science 91: 316-321.
Smith, K.A., D.R. Charles and D. Moorhouse. 2000. Nitrogen excretion by farm livestock with respect to land spreading requirements and controlling nitrogen losses to ground and surface waters. Part 2: pigs and poultry. Bioresource Technology 71: 183-194.
US EPA. 2004. National Emission Inventory-Ammonia Emissions from Animal Husbandry Operations (Draft Report, January 30, 2004). http//www.epa.gov/ttnchiel/ap42/ch09/related/nh3inventorydraft_jan 2004.
Valli, L., S. Piccinnini and G. Bonazzi. 2004. Ammonia emission from two poultry manure drying systems. In V.C. Nielsen, J.H. Voorburg, P. L’Hermite. Odour and Ammonia Emissions from Livestock Farming.
Wang, W., L. Zhao, X. Wang, R. Manuzon, H. Li, M. Darr, H. Keener, A Heber and J. Ni. 2009. Estimation of ammonia emission from manure belt poultry layer houses using an alternate mass-balance method. Agricultural and Biosystems Engineering Conference Papers, Posters and Presentations.
