
Baseline methane emission from dairy manure storages in Abbotsford
In this post, we estimate baseline methane emission from dairy manure storage in Abbotsford to be 8278 tonnes CO2 equivalent, using internationally accepted protocols for calculating baseline methane emissions from manure storage.
“Some countries for which livestock emissions are particularly important may wish to go beyond the Tier 2 method and develop models for country-specific methodologies or use measurement–based approaches to quantify emission factors. The method chosen will depend on data availability and national circumstances. Good practice in estimating CH4 emissions from manure management systems entails making every effort to use the Tier 2 method, including calculating emission factors using country-specific information. The Tier 1 method should only be used if all possible avenues to use the Tier 2 method have been exhausted and/or it is determined that the source is not a key category or subcategory.” (IPCC 2006).
The following four steps are used to estimate CH4 emissions from manure management (IPCC 2006)::
Step 1: Collect population data from the Livestock Population Characterization (see Section 10.2)
Step 2: Use default values or develop country-specific emission factors for each livestock subcategory in terms of kilograms of methane per animal per year.
Step 3. Multiply the livestock subcategory emission factors by the subcategory populations to estimate subcategory emissions, and sum across the subcategories to estimate total emissions by primary livestock species.
Step 4: Sum emissions from all defined livestock species to determine national emissions.
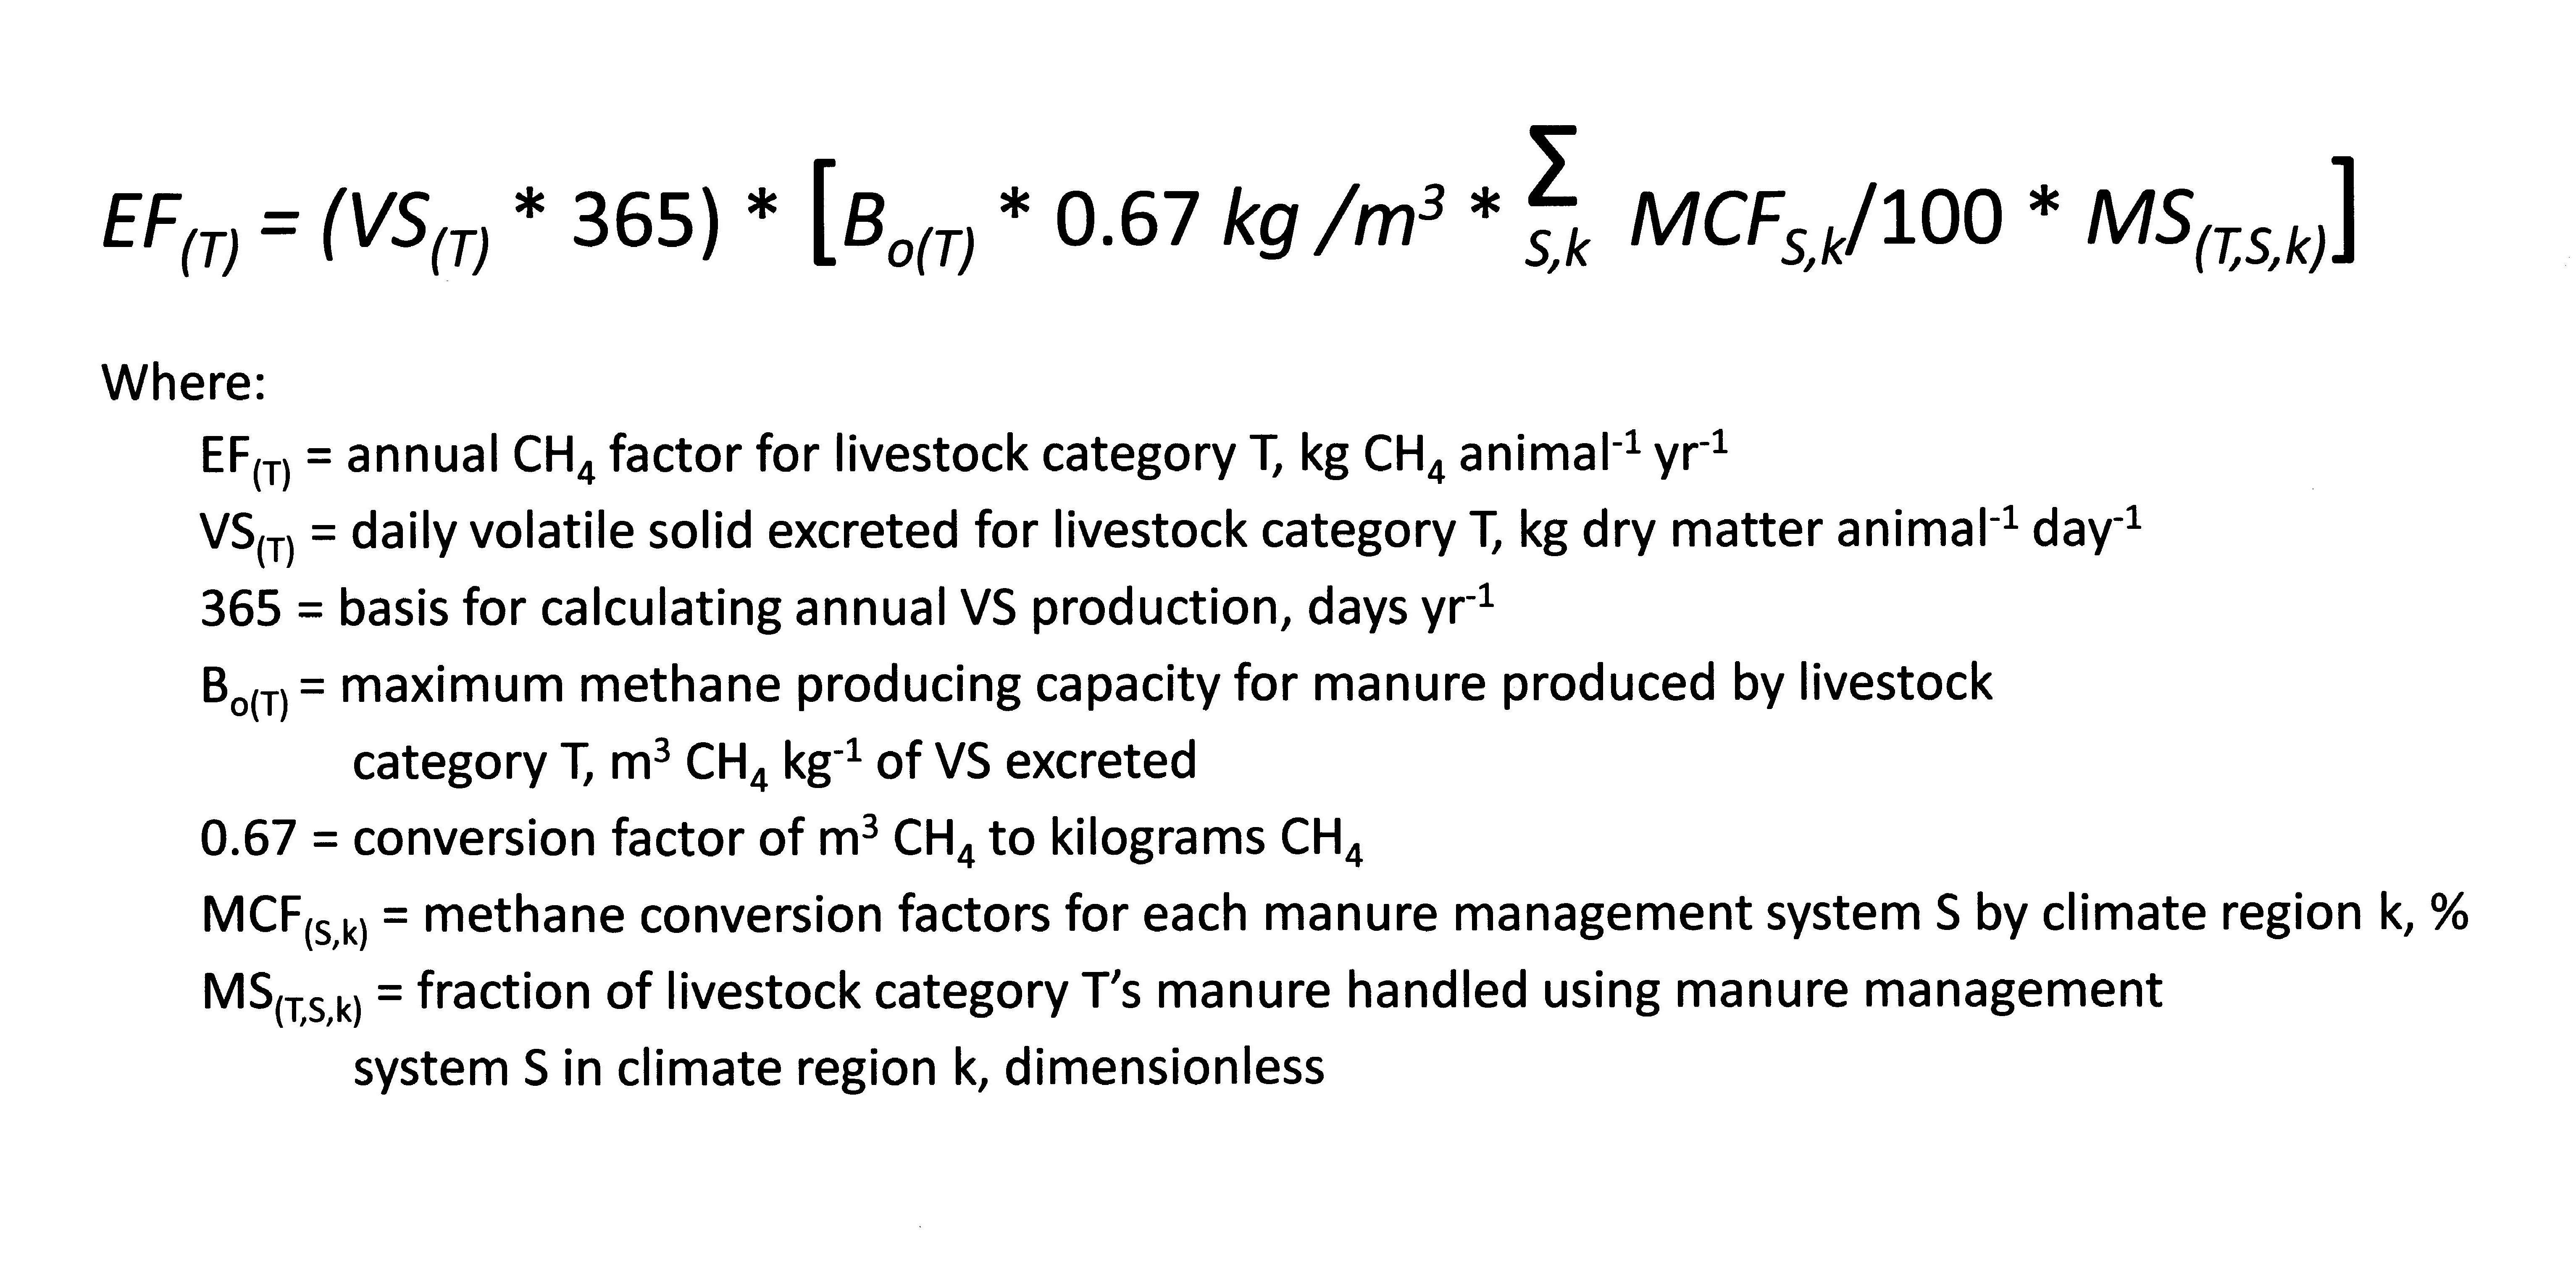
Calculation of methane emissions from manure storage (IPCC 2006)
The dairy industry developed a methane emissions protocol where methane emission from manure storage (tonnes CO2 eq per year) = kg DM/head/day of volatile solids excretion from a specific animal group x number of animals in group x 365 days per year x maximum methane producing capacity from dairy manure (Bo – default is 0.24 m3 of methane per kg of volatile solids) x methane conversion factor (% of volatile solids converted to methane under storage conditions) (Atlantic Dairy and Forage Institute 2008, and Government of Alberta 2010). They suggested that methane emissions could be calculated monthly to account for influence of temperature and timing of manure removal. They report the methane conversion factor for British Columbia as 25.8% (which came from Verge et al. 2007).
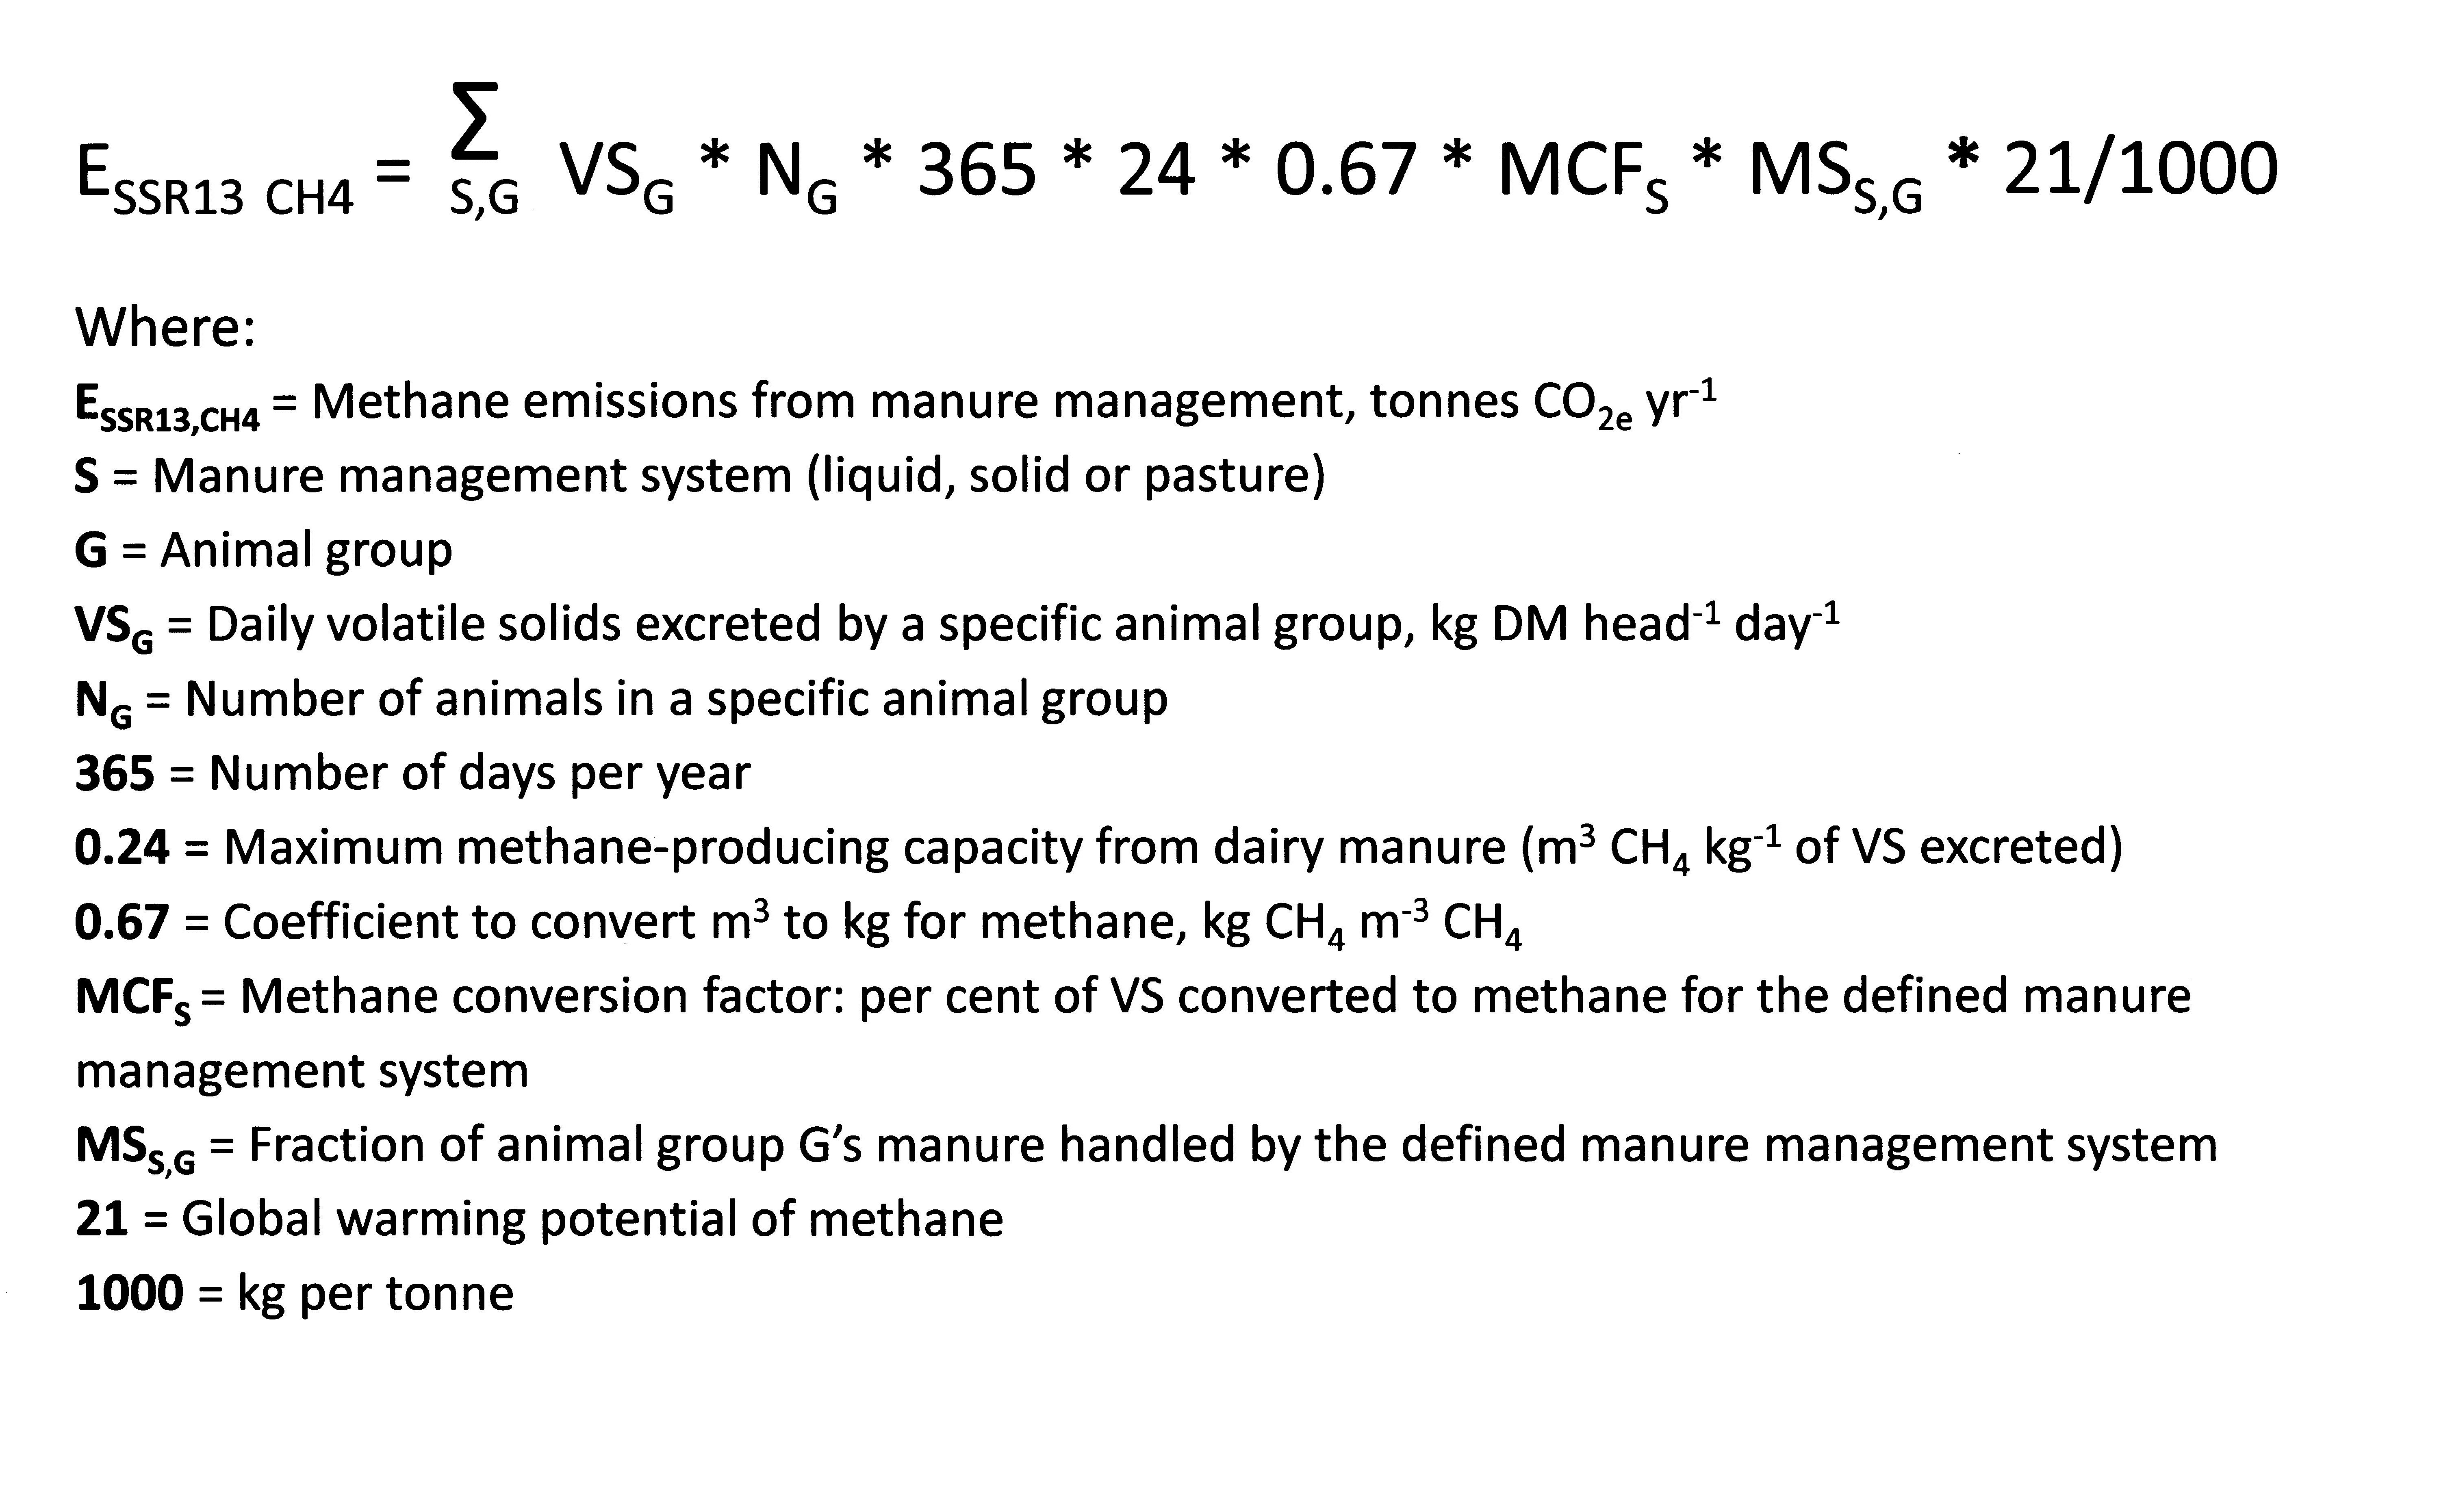
Equation for measuring methane emission from manure storage in Canada (Govt of Alberta 2010)
Two numbers required are the daily volatile solid excretion per specific animal group (VS), and the maximum methane producing capacity from dairy manure (Bo). Washington State uses a VS excretion of 8.35 and 4.07 kg dry VS per animal per day (US EPA 2010). They also use a Bo of 0.24 for dairy cows and 0.17 for dairy heifers. The default volatile solids excretion (VS) in Europe used is 5.08 and 2.65 for dairy cattle and non-dairy cattle, respectively (Amon et al 2005). They use the same Bo values of 0.24 and 0.17 for dairy cattle and non dairy cattle. The average VS excretion used in Austria is 3.86 kg per animal per day, however, milk production rates are also lower than in western Canada. Holler et al. (2004) measured an average VS excretion of 4.08 kg per lactating dairy cow er day. Weiss and St-Pierre (2010) summarized data from experiments on lactating dairy cattle in Ohio showing average VS excretion of 8.57 kg dry matter per animal per day. They found that as feed intake increased, VS also increased because the feed went through the animal faster and efficiency of digestion decreased. They concluded that “A Holstein cow producing 23 kg of milk averages about 59 kg of manure (2.6 kg of manure/kg of milk) but a Holstein producing 45 kg of milk produces 80 kg of manure or only 1.75 kg of manure/kg of milk. Increasing milk production is usually the most effective means of decreasing manure output per unit of milk produced.”
The Bo value refers to the ultimate methane yield, which is lower than the theoretical methane yield because some of the manure volatile solids are used to produce microbial biomass and lignin containing compounds will only be degraded to a limited degree (Holler et al. 2004). IPCC (2006) uses a default Bo value of 0.24 and 0.17 m3 of CH4 per kg VS for dairy cows and dairy heifers, respectively. The US EPA (2010) has adopted these same values. Holler et al. (2004) measured Bo values of 0.148 during actual experiments with dairy cattle manure in Denmark.

Baseline calculations of methane emissions during manure storage from Abbotsford’s 13,886 dairy cows and 6,377 heifers.
The total methane (CO2 equivalents) from dairy manure management in Abbotsford ranges from 2,970 tonnes using conservative factors to 42,717 tonnes using a high MCF factor used in some previous estimates. My professional opinion based on the science that we have reviewed and current manure management practices is 8,278 tonnes total greenhouse gas emission from methane emission during manure storage.
Using the total of 8,278 tonnes total greenhouse gas emission from methane, the methane emission per cow during manure storage is 24 kg. This compares with Bertrand and Hacala (2007), who summarized the IPCC 1997 methane emission factors as: North America dairy cow 36 kg/head/yr compared to the Western Europe dairy cow at 14 kg/head/yr under cool climate conditions (Abbotsford is considered cool climate conditions). A report by Sonesson et al. (2009) used experimental data of 11.4-12.4 kg per cow per year methane loss during manure storage in Northern Europe, suggesting that the estimated methane emissions still may be overstated.
References
Amon, B., M. Frolich, K. Hopfner-Sixt and T. Amon. 2005. Emission inventory for the agricultural sector in Austria: state of the art and future developments. In Kuscynski, T., U. Dammgen, J. Webb and A. Myzcko, eds. Emissions from European Agriculture. pp. 147-179.
Atlantic Dairy and Forage Institute. 2008. Greenhouse Gas Protocol for the Canadian Dairy Industry. http://www.adfiresearch.org/GHG/Appendix_C.pdf
Bertrand, S., and S. Hacala. 2007. Generation and sources of greenhouse gases in the dairy industry. In Reduction of Greenhouse Gas Emissions at Farm and Manufacturing Levels. Bulletin of the International Dairy Federation 422/2007.
Government of Alberta. 2010. Quantification Protocol for Emission Reductions from Dairy Cattle. Specified Gas Emitters Regulation. Version 1.0
Holler, H.B., S.G. Sommer and B.K Ahring. 2004. Methane productivity of manure, straw and solid fractions of manure. Biomass and Bioenergy 26: 485-495.
IPCC. 2006. 2006 IPCC Guidelines for National Greenhouse Gas Inventories. Volume 4. Agriculture, Forestry and Other Land Use. Chapter 10. Emissions from Livestock and Manure Management. http://www.ipcc-nggip.iges.or.jp/public/2006gl/pdf/4_Volume4/V4_10_Ch10_Livestock.pdf
Karimi-Zindashty, Y., J.D. MacDonald, R.L. Desjardins, D.E. Worth, J.J. Hutchinson, and X.P.C. Verge. 2012. Sources of uncertainty in the IPCC Tier 2 Canadian livestock model. Journal of Agricultural Science 150:556-559.
Sonesson, U., C. Cederberg and M. Berglund. 2009. Greenhouse gas emissions in beef production. Klimatmarkning For Mat. 2009-4.
US EPA 2010. Code of Federal Regulations. Title 40. Protection of the Environment. Part 98. Mandatory Greenhouse Gas Reporting. Subpart JJ Manure Management. http://cfr.vlex.com/vid/98-368-definitions-300325402
Verge, X.P.C., J.A. Dyer, R.L. Desjardins and D. Worth. 2007. Greenhouse gas emissions from the Canadian dairy industry in 2001. Agricultural Systems 94: 683-693.
Weiss, W.P., and N. St-Pierre. 2010. Feeding strategies to decrease manure output of dairy cows. WCDS Advances in Dairy Technology 22: 229-237.
